
Figure 3.
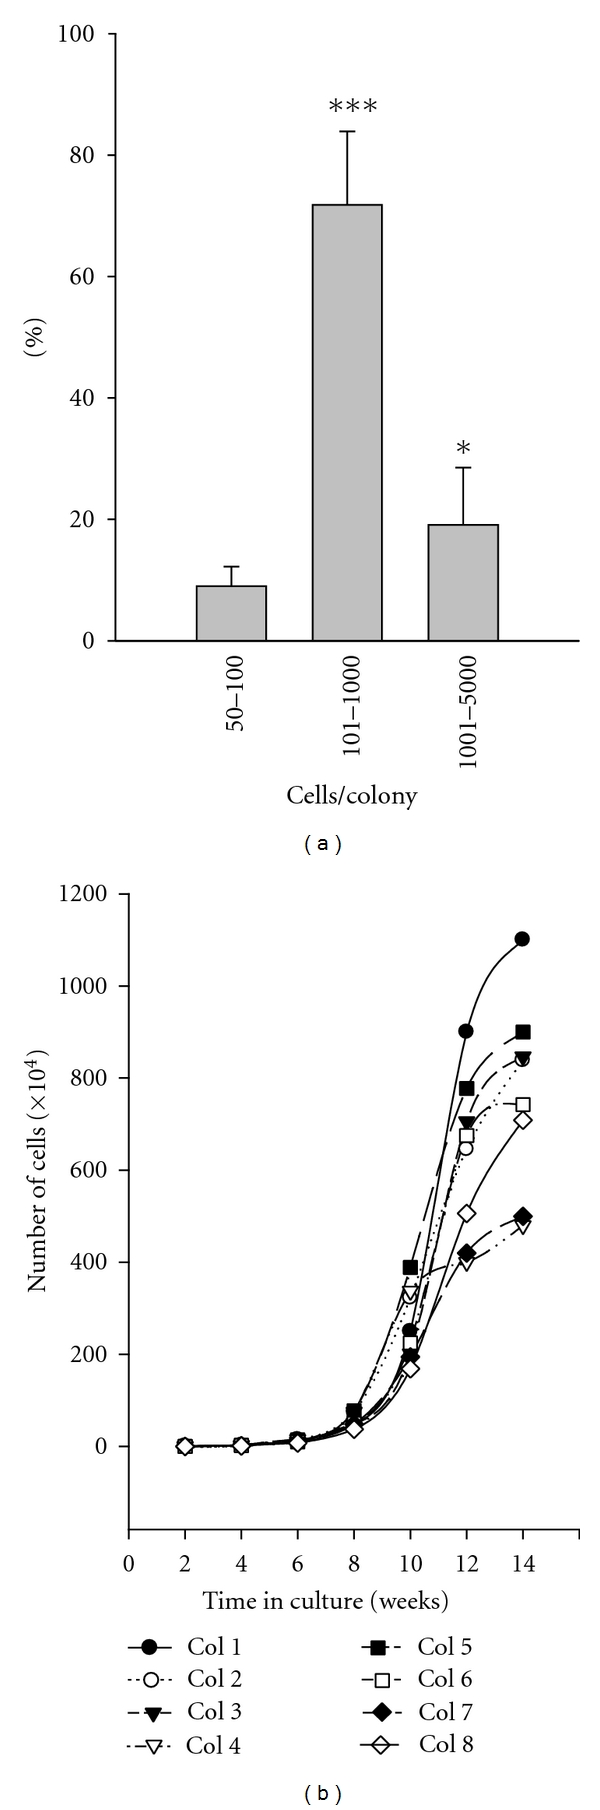
Proliferative capacity assay of bone-marrow-derived EPC. (a) Distribution of different sizes of EC-col after 21 days of culture. Each bar represents the mean ± SD of 3 experiments. *P < 0.05, ***P < 0.001 in comparison to the group of 50–100 cells. (b) Growth curve of eight large EC-cols. The number of cells from each colony was counted every 2 weeks for 14 weeks.