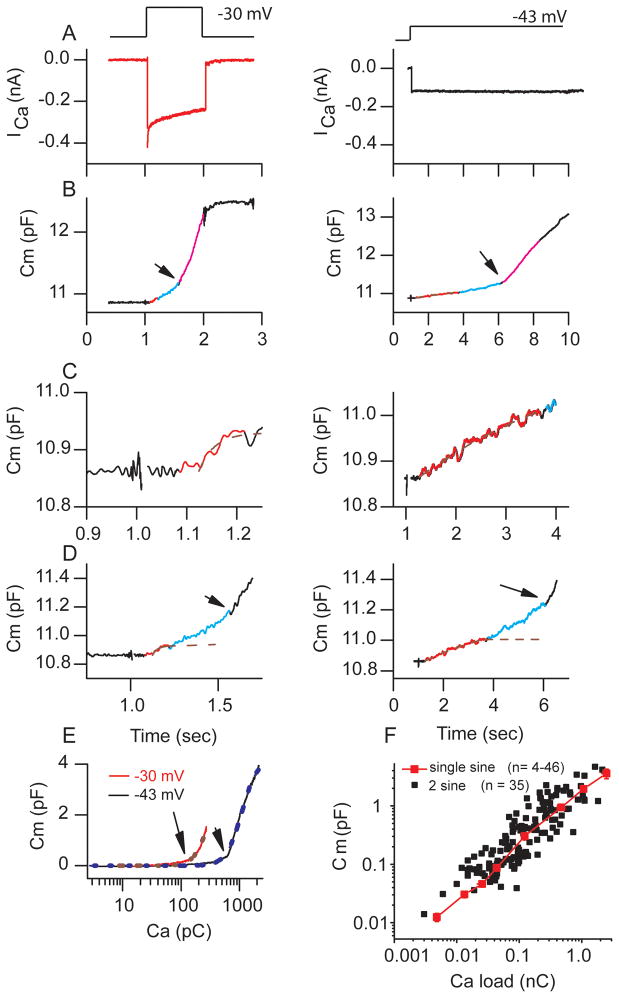
Figure 2.
Two Ca2+-dependent components of vesicle release were observed during hair cell depolarization. (A) ICa elicited in response to membrane depolarization from −85 mV to −30 mV (75% peak, left) or −43 mV (35% of peak, right). (B) Capacitance change elicited in response to ICa in (A); arrow indicates superlinear onset. Colors demark regions where rates are different. (C) Expansion of the axis of (B). Red identifies a saturable pool of vesicles that differs in amplitude between stimulus protocols. Blue indicates intermediary component that also is saturable depending on Ca2+ load and purple represents the superlinear component. (D) Expansion of plots in (B) to illustrate the intermediate component of release where depletion has ended but superlinear response has not started. Dashed line is exponential fit showing depletion. (E) Capacitance against Ca load (integral of current in A), demonstrating both linear and nonlinear (indicated by arrow) responses. Dashed lines are fit to Hill Equation: Cm = Cm(max)*xn/(kn + xn) where n is Hill coefficient (r2 = 0.99, see text for details). (F) Plots capacitance change after stimulation from high frequency (1 mM EGTA internal) cells included in this study for varying intensities and durations of depolarization as compared to previous data obtained with single sine wave method (Schnee et al., 2005).

