
Figure 8.
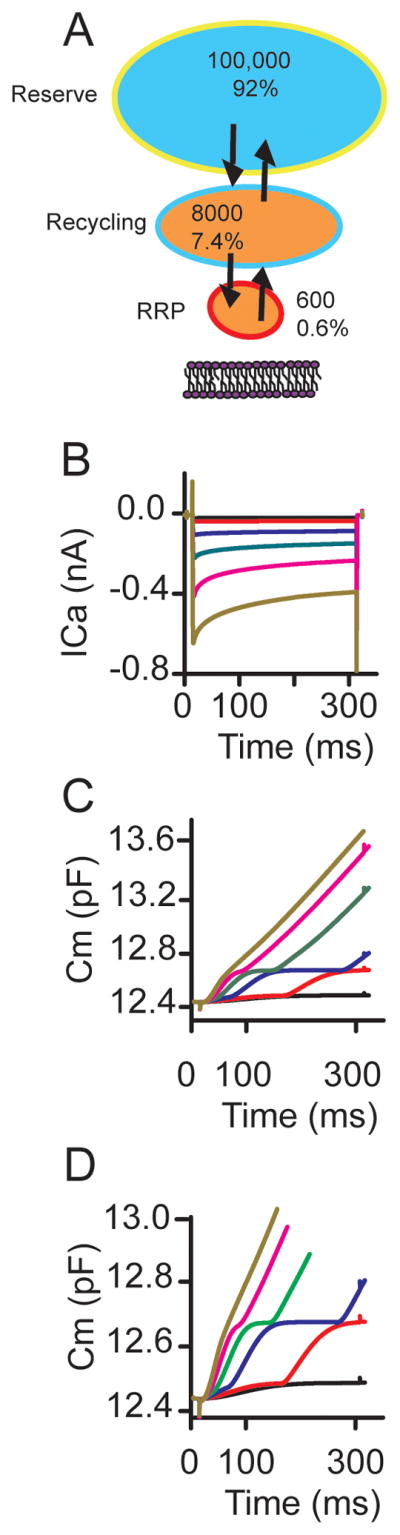
Mass action model incorporating first order Ca2+ dependence of trafficking and release reproduces release data. (A) schematic representation of model, identifying vesicle pools, rate constants as well as Ca2+ gradients. (B) is Hodgkin Huxley model of ICa in response to increasing depolarizations from −53 in 3 mV increments. (C) Corresponding capacitance changes elicited, (D) expansion of y-axis to better visualize vesicle pools.