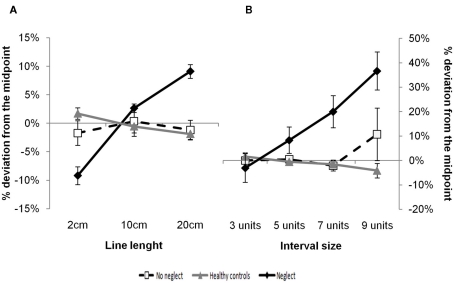
Figure 1.
Physical line bisection (A) and number interval bisection (B) in neglect patients, patients without neglect and healthy controls. Both figures show the average proportional difference between reported and correct midpoints for the different line and interval lengths. Zero reflects a correct response, while positive values indicate a rightward shift or an overestimation of the midpoint and negative values a leftward shift or an underestimation. Error bars give the SEM across subjects.

