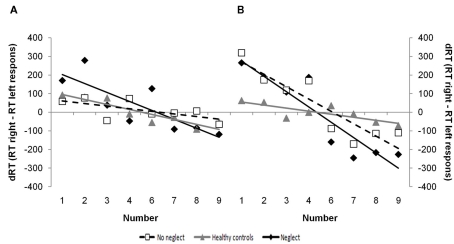
Figure 2.
SNARC-effects of magnitude comparison and parity judgment in neglect patients, patients without neglect and healthy controls. The observed data and the regression line represent the response time differences (dRT) between right and left responses as a function of the numerical magnitude in parity judgment (A) and magnitude comparison (B).

