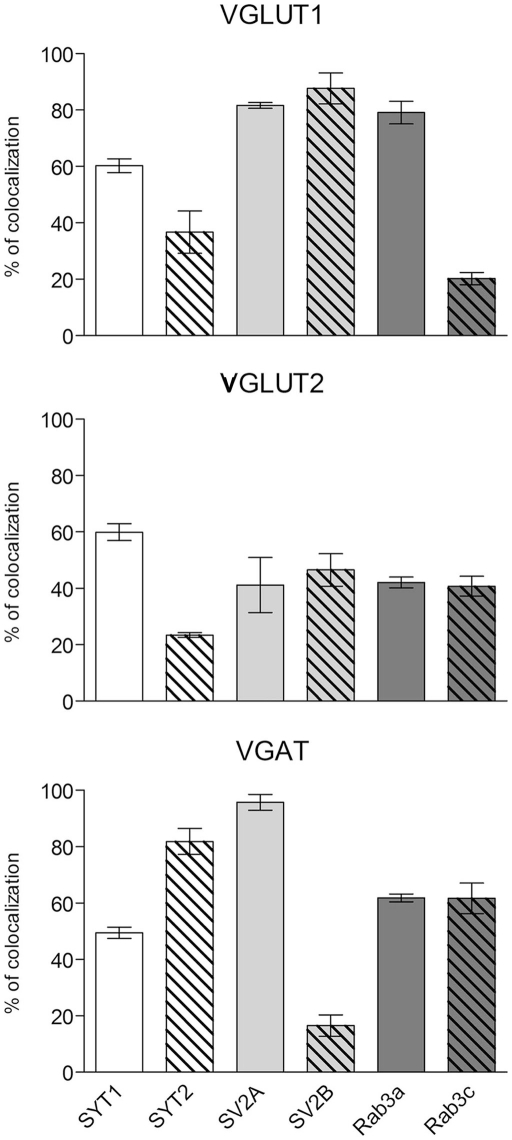
Figure 3.
Co-localization of SYT1, SYT2, SV2A, SV2B, Rab3a, and Rab3c in VGLUT1+, VGLUT2+, and VGAT+ axon terminals in cerebral cortex. Values (means ± SEM) refer to the percentages of total puncta positive for the respective protein isoform for each of the three terminal populations identified based on the specific vesicular transporter.

