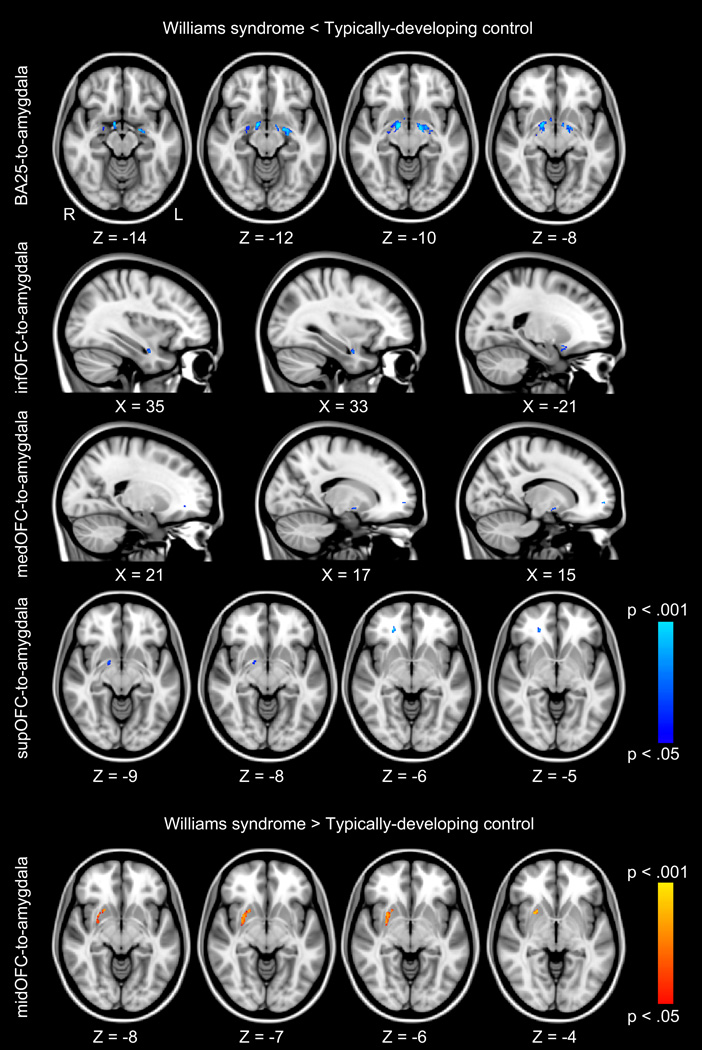
Fig. 1.
Tractography analysis of prefrontal-amygdala pathways. Blue clusters represent white matter regions where individuals with Williams syndrome have significantly lower fractional anisotropy (FA) values, p < .05, family-wise error (FWE) corrected for multiple comparisons than typically-developing controls. Red clusters represent white matter regions where individuals with Williams syndrome have significantly higher FA values (p < .05, FWE corrected) than typically-developing controls. Anatomically, FA differences are located bilaterally within the ventral amygdalofugal pathway, the uncinate fasciculus, the inferior longitudinal fasciculus, and the inferior fronto-occipital fasciculus. FA differences are overlaid onto the MNI-152 T1-weighted standard brain. Subgenual anterior cingulate (BA25); inferior orbitofrontal cortex (infOFC); medial orbitofrontal cortex (medOFC); middle orbitofrontal cortex (midOFC); superior orbitofrontal cortex (supOFC).

