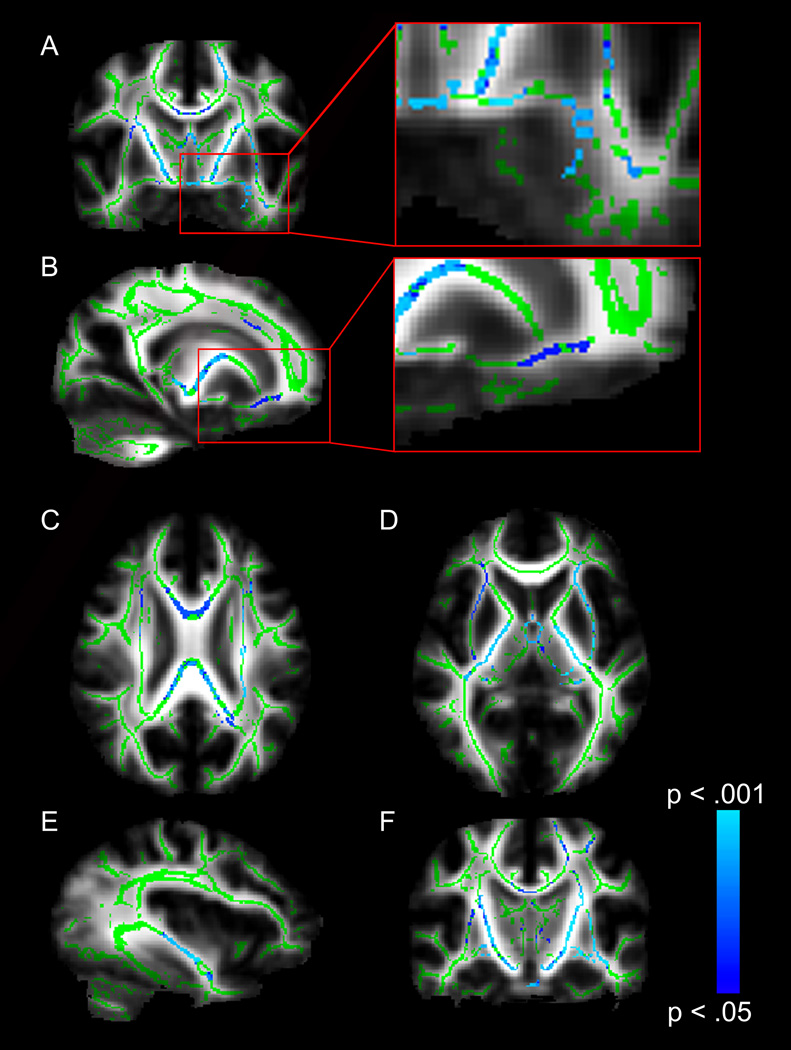
Fig. 2.
TBSS analysis of whole-brain white matter differences. Blue voxels represent white matter regions where individuals with Williams syndrome (WS) have lower fractional anisotropy (FA) values (p < .05, FWE corrected) than typically-developing controls. Voxels are overlaid on the TBSS white matter skeleton (green) and the FMRIB-58 FA standard brain (grayscale). (A) Coronal image showing lower FA in individuals with WS in the left ventral amygdalofugal pathway. (B) Sagittal image showing lower FA in individuals with WS in the right uncinate fasciculus pathway. (C) Axial image showing lower FA in individuals with WS in the corpus callosum. (D) Axial image showing lower FA in individuals with WS in bilateral external capsules and bilateral posterior limbs of the internal capsule. (E) Sagittal image showing lower FA in individuals with WS in the inferior fronto-occipital fasciculus. (F) Coronal image showing lower FA in individuals with WS in bilateral corticospinal tracts.

