Figure 1.
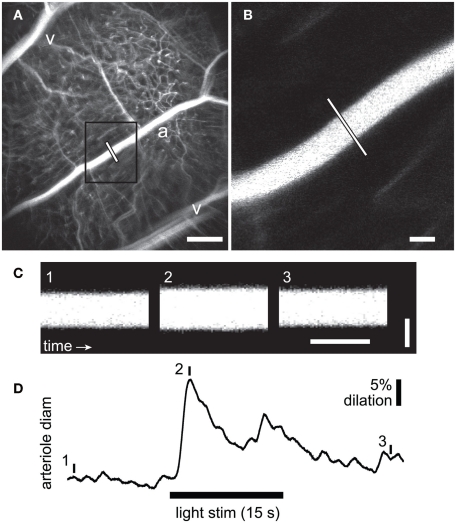
Measurement of flicker-induced changes in retinal arteriole diameter using confocal line scans. (A) Low power confocal image of retinal vessels. Arterioles (a) can be distinguished from venules (v) by their branching pattern and relative size. The diameter of the arteriole was measured with confocal line scans (white line). Scale bar, 250 μm. (B) High magnification image of the boxed area in A showing the region of the arteriole where line scans were taken. Scale bar, 25 μm. (C) Segments of a line scan image from the arteriole in (B). The vertical bars in (D) indicate the times at which the three segments were taken. Distance is represented vertically (scale bar, 25 μm) and time horizontally (scale bar, 100 ms). A diffuse flickering light-evoked vessel dilation, indicated by the widening of the vessel in segment 2. (D) Time course of the flicker-induced arteriole dilation. The onset of the flickering light (black bar at bottom) evoked an initial transient dilation followed by a smaller secondary dilation.

