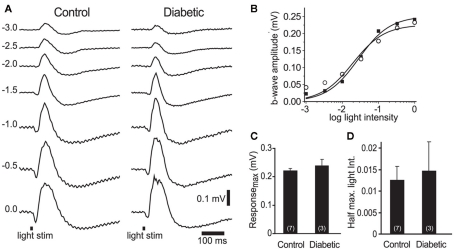
Figure 4.
Electroretinogram recordings from control and diabetic animals were similar. (A) Intensity series of ERG traces from a control and a diabetic animal to 10 ms light flashes (black bars at bottom) of increasing intensities (numbers indicate intensity in log units). (B) Intensity-response relations for the control (open circles) and diabetic (black squares) series shown in (A). (C,D) The maximum b-wave response (C) and the light intensity evoking a half-maximal b-wave response (D) were similar in control and diabetic animals (P > 0.4). The data were fit with the Rushton–Naka relation (Naka and Rushton, 1966).

