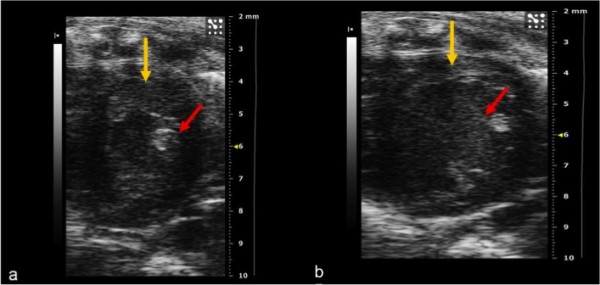
Figure 2.

(a, b) B-mode image of the left ventricle. Short-axis view during systole (a) and diastole (b). The red arrow shows the papillary muscle, the yellow arrow indicates the thickness of the left ventricle anterior wall. This is the best window for evaluating contractility.
