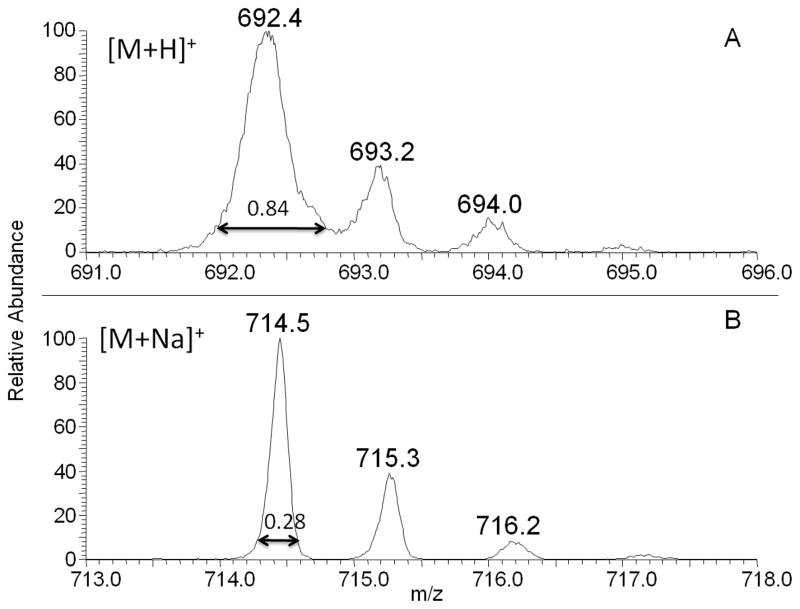
Figure 2.
Spectrum A, above, is a zoom scan of protonated phosphatidylethanolamine (PE) 16:0/16:0. The peak width at 10% peak height (PW10%) was determined to be 0.84±0.05. The peak width for the sodiated counterpart, measured from the zoom scan in spectrum B, was 0.28±0.03. A narrower isolation width indicates that the sodiated species is less fragile than the protonated species in ion trap mass analysis.

