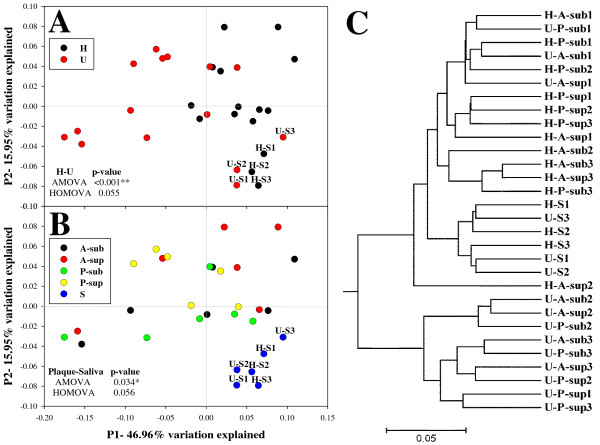
Figure 2.
Comparisons of bacterial community structures as measured by FastUniFrac. Community structures from H and U Groups (A) or from the different sites (B) were interrogated using principal coordinate analysis (PCoA) and clustering analysis of the weighted UniFrac distance matrix. Each point corresponds to a microbial community, with color indicating its category. Percentages of variation explained by the plotted principal coordinates were indicated on the axes.

