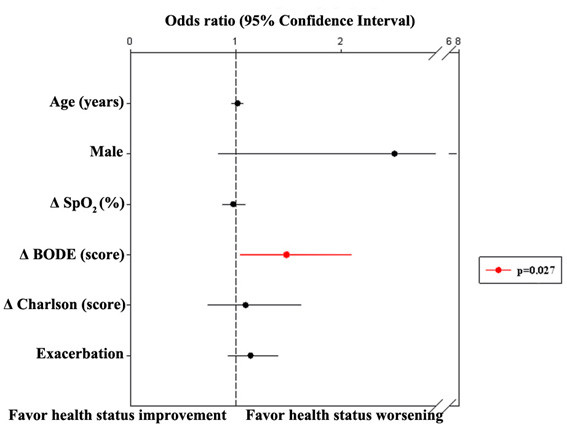
Figure 3.

Multiple logistic regression analysis to evaluate the predictors for stability/improvement or worsening (≥ 4%) on SGRQ total score (n = 95). Δ: final assessment values-initial assessment values; SpO2: pulse oximetry; Exacerbation: number of exacerbations for patient in the three-year period.
