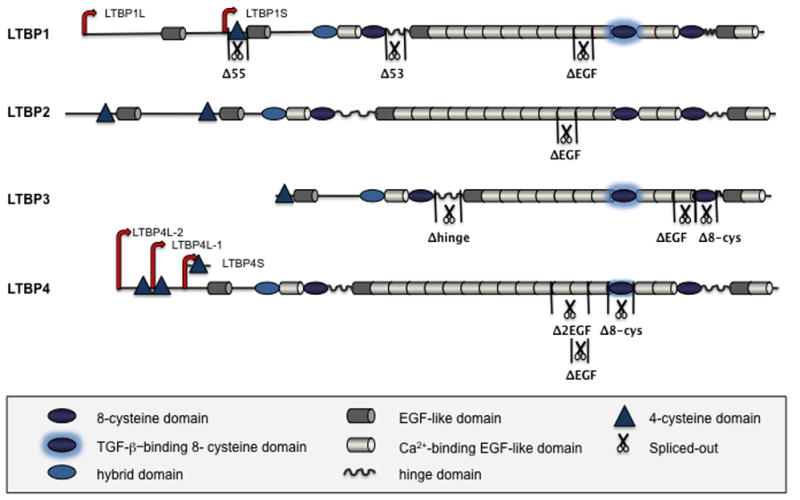
Figure 1. Schematic representation of the LTBP family domain organization.

Four LTBPs are shown, with domain symbols depicted in the boxed area below the Figure. Major isoforms and known splice variants of LTBPs are also illustrated [Robertson et al., 2010].
