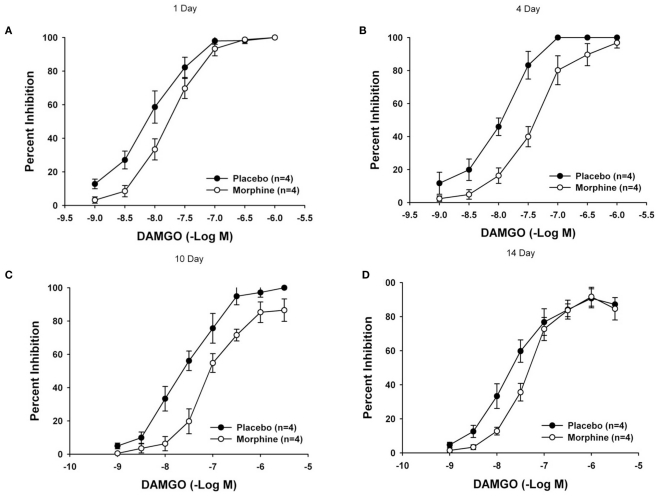
Figure 3.
Mean concentration–response curves illustrating the effect of chronic morphine treatment on DAMGO-mediated inhibition of neurogenic twitches in the LM/MP. Mean concentration–response curves in tissues obtained from animals 1 day (A), 4-days (B), 10-days (C), and 14-days (D) after pellet implantation are shown. The magnitude of the degree of tolerance is assessed by comparing the geometric mean IC50 values (Table 2). A p value of ≤0.05 was considered statistically significant.

