Table 1.
Structure–activity relationships and lead optimization summary.
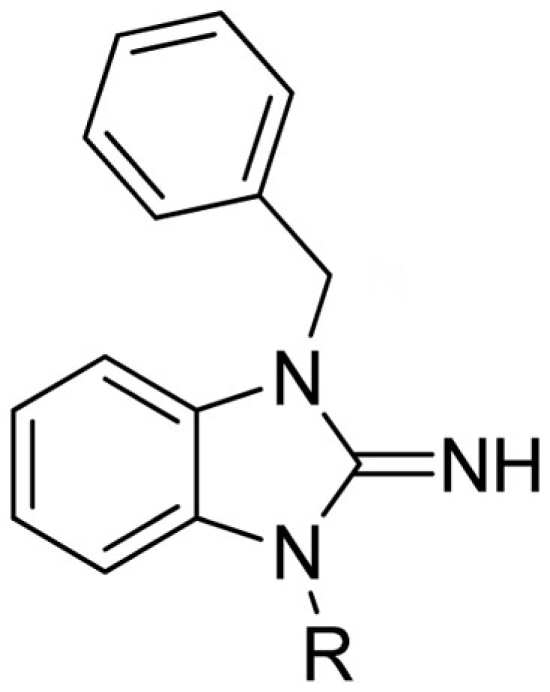 | |||||||
|---|---|---|---|---|---|---|---|
| Cmpd | R | VU#/Barcode | IC50 (μM) |
||||
| Kir2.3 | Kir7.1 | GIRK | Kir1.1 | ||||
| 1 | 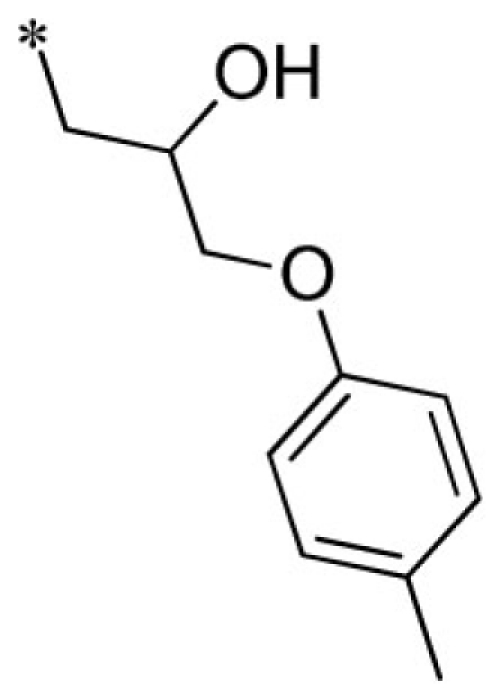 |
VU0160573-1/IC4X | 4.15 ± 0.35 | 4.77 ± 2.89 | 2.17 ± 0.40 | 10.8 ± 3.8 | |
| 2 | 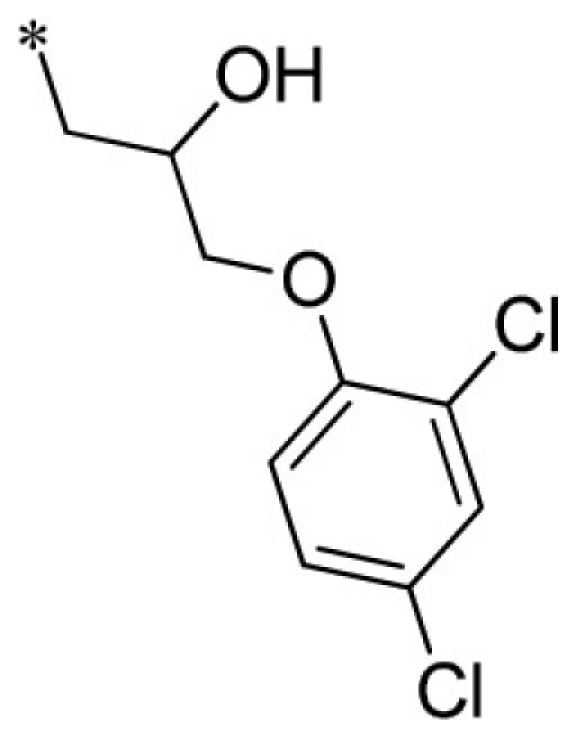 |
VU0403134-1/IC3Y | 5.33 ± 2.08 | 4.73 ± 2.57 | 3.20 ± 0.71 | 7.07 ± 2.30 | |
| 3 | 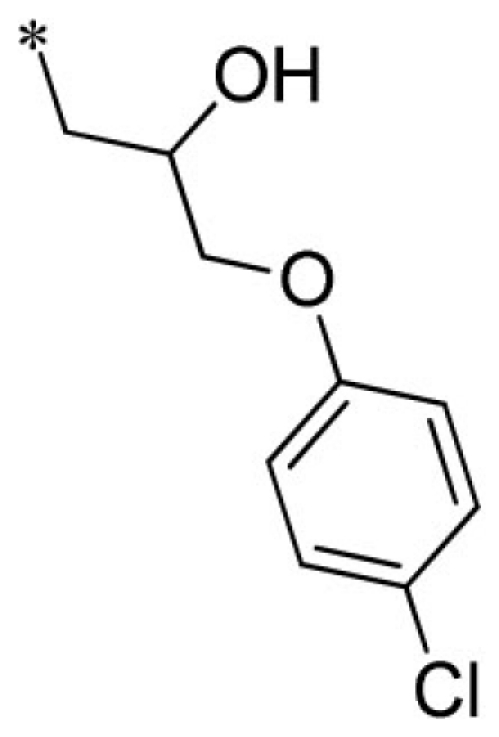 |
VU0403131-1/IC58 | 4.20 ± 1.25 | 5.17 ± 1.89 | 2.90 ± 1.10 | 6.57 ± 3.80 | |
| 4 | 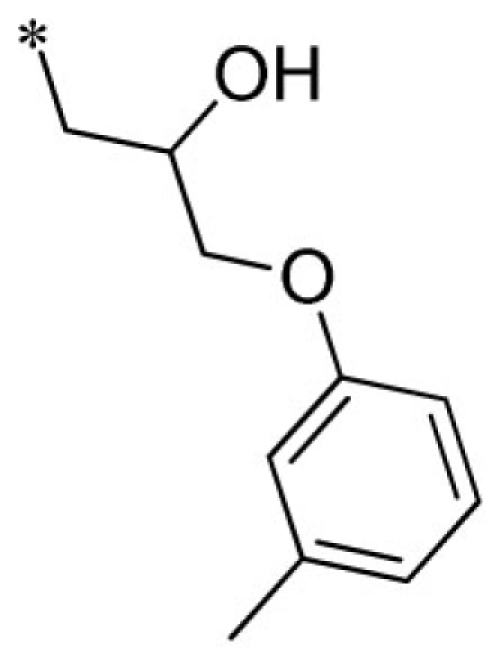 |
VU0340260-1/IC38 | 7.53 ± 2.34 | 8.00 ± 3.86 | 4.95 ± 1.80 | 11.2 ± 2.8 | |
| 5 | 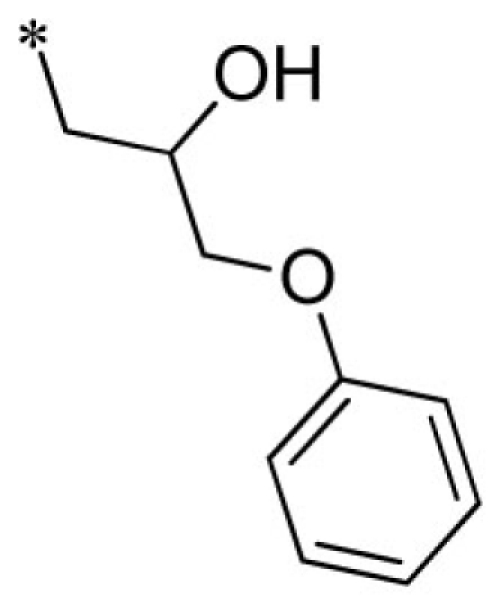 |
VU0026784-1/IC3L | 3.43 ± 0.67 | 4.47 ± 2.40 | 1.95 ± 0.49 | 11.7 ± 4.1 | |
| 6 | 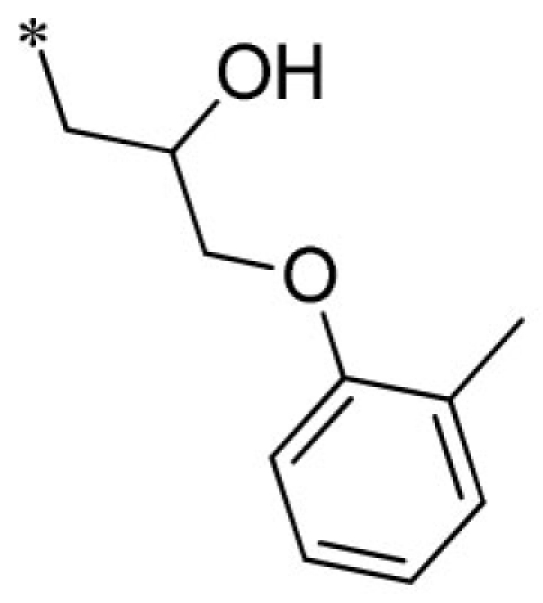 |
VU0288495-1/IC39 | 5.33 ± 1.70 | 4.10 ± 1.93 | 1.95 ± 0.07 | 11.9 ± 2.2 | |
| 7 | 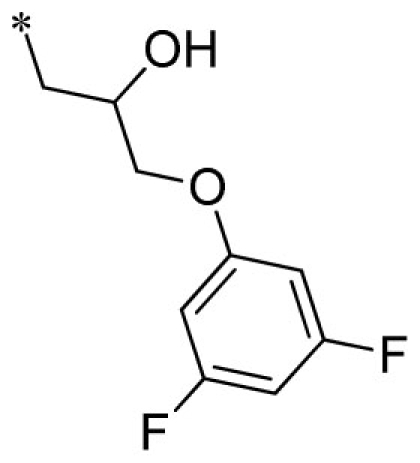 |
VU0451348-1/R6P | 3.53 ± 1.33 | 4.20 ± 0.95 | 1.40 ± 0.35 | 7.57 ± 2.20 | |
| 8 | 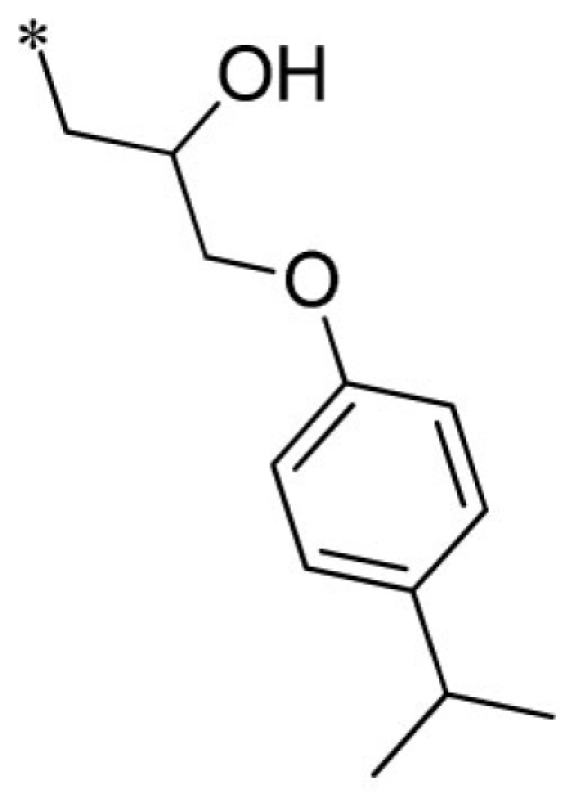 |
VU0451344-1/R80 | 5.03 ± 1.96 | 6.03 ± 1.60 | 3.37 ± 0.70 | 6.77 ± 1.70 | |
| 9 | 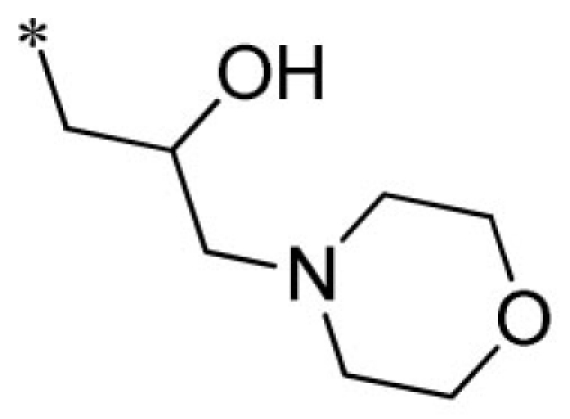 |
VU0451342-1/R70 | 24.0 ± 10.4 | >100 | 15.3 ± 0.6 | >100 | |
| 10 | 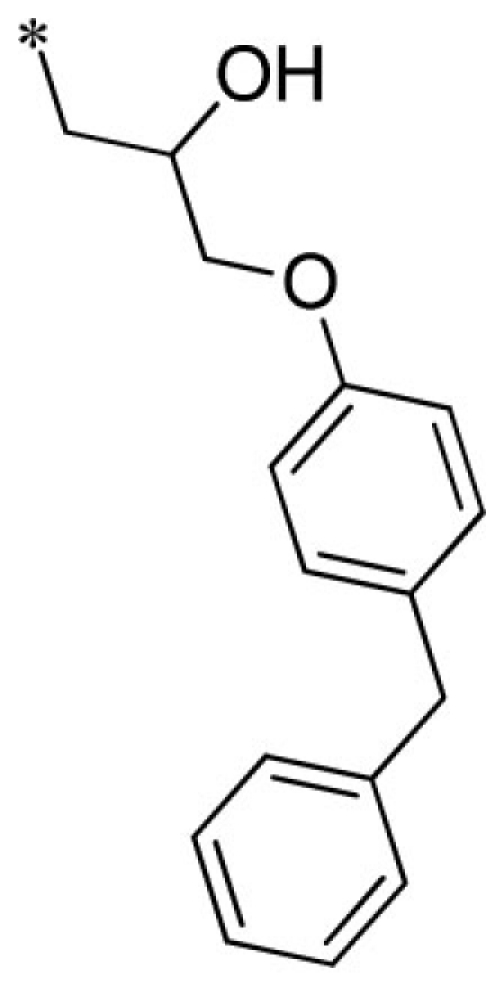 |
VU0451341-1/R7M | 2.80 ± 0.99 | 6.07 ± 2.71 | 3.83 ± 1.10 | 6.13 ± 0.23 | |
| 11 | 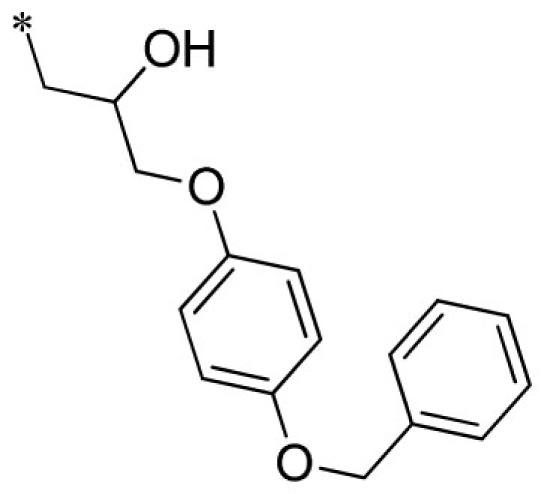 |
VU0451340-1/R5C | 2.33 ± 0.68 | >100 | 3.17 ± 0.86 | 5.23 ± 0.59 | |
| 12 | 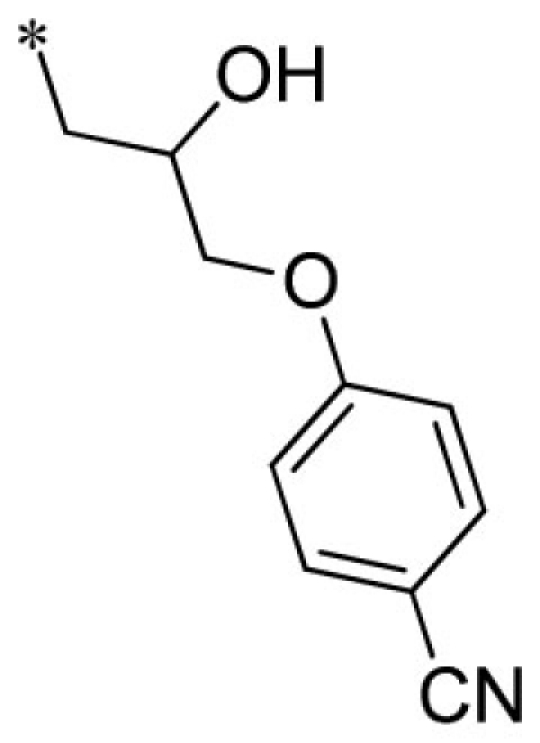 |
VU0451339-1/R56 | 11.3 ± 1.2 | 19.7 ± 7.4 | 5.27 ± 0.40 | 15.7 ± 2.1 | |
| 13 | 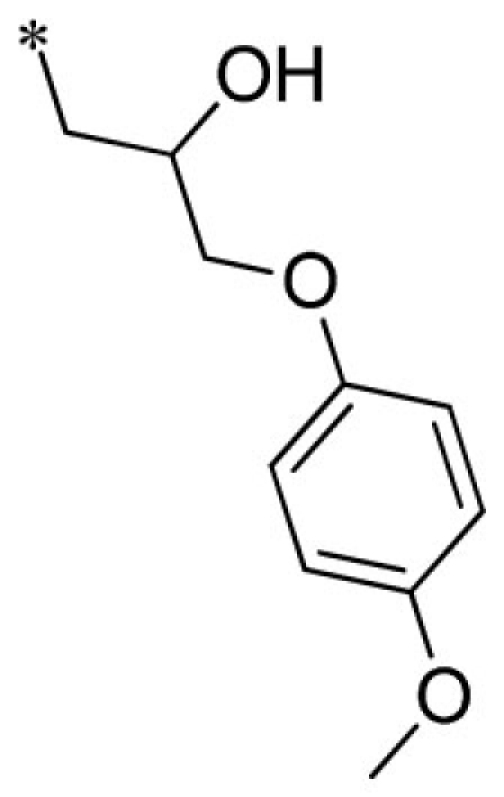 |
VU0066224-6/R7N | 3.87 ± 1.40 | 6.70 ± 1.39 | 1.50 ± 0.44 | 12.7 ± 1.2 | |
| 14 | 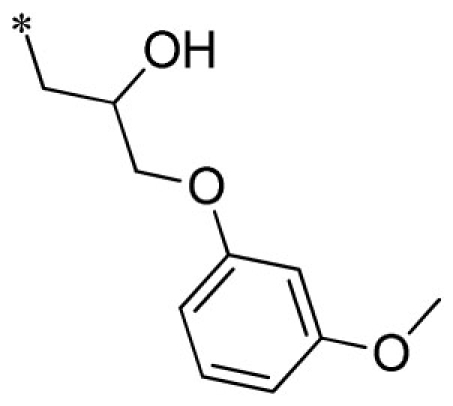 |
VU0451336-1/R5B | 3.13 ± 1.45 | 3.47 ± 0.67 | 1.43 ± 0.25 | 10.1 ± 2.9 | |
| 15 | 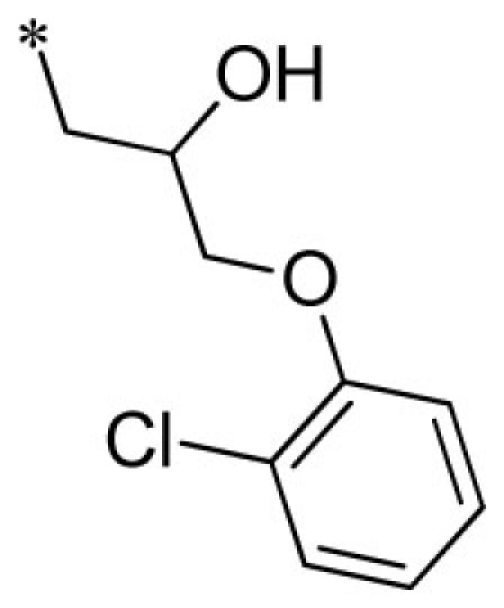 |
VU0451333-1/R5X | 4.95 ± 1.34 | 5.33 ± 2.91 | 2.77 ± 0.60 | 8.60 ± 1.20 | |
| 16 | 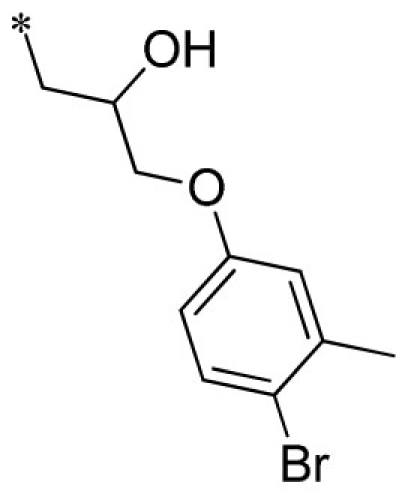 |
VU0451337-1/R5K | 5.10 ± 1.27 | 6.10 ± 3.12 | 3.43 ± 0.21 | 8.53 ± 1.70 | |
| 17 | 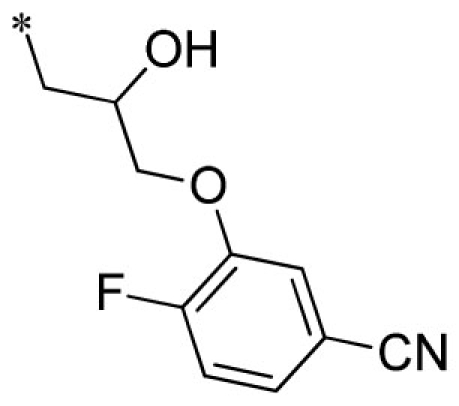 |
VU0451332-1/R7B | 5.30 ± 1.56 | 4.33 ± 1.33 | 1.40 ± 0.30 | 8.27 ± 0.29 | |
| 18 | 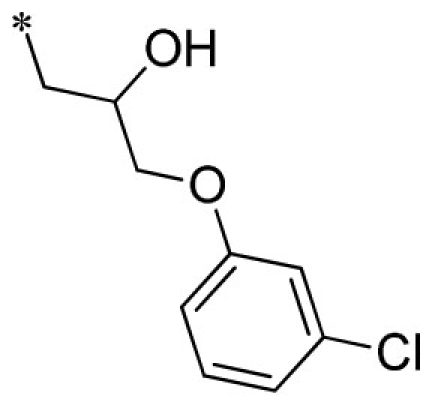 |
VU0451338-1/R71 | 4.45 ± 0.92 | 5.63 ± 2.24 | 2.83 ± 0.42 | 11.7 ± 2.1 | |
| 19 | 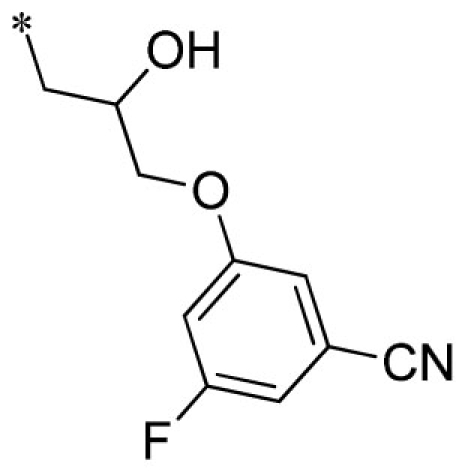 |
VU0451330-1/R6J | 7.15 ± 0.71 | 8.27 ± 2.37 | 1.93 ± 0.21 | 14.3 ± 1.5 | |
| 20 | 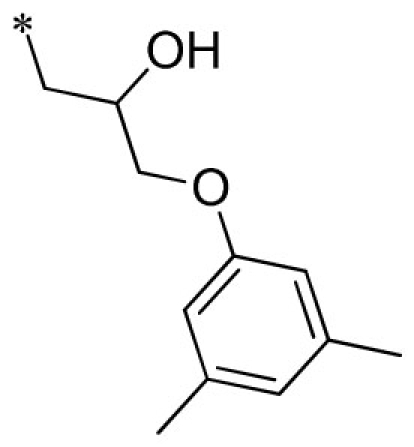 |
VU0451331-1/RKN | 3.65 ± 0.21 | 3.03 ± 0.68 | 4.33 ± 0.68 | 16.0 ± 2.0 | |
| 21 | 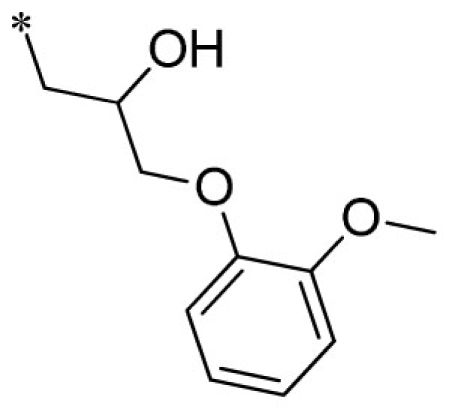 |
VU0451846-2/R87 | 3.60 ± 0.28 | 8.50 ± 2.18 | 5.13 ± 1.60 | 19.3 ± 1.5 | |
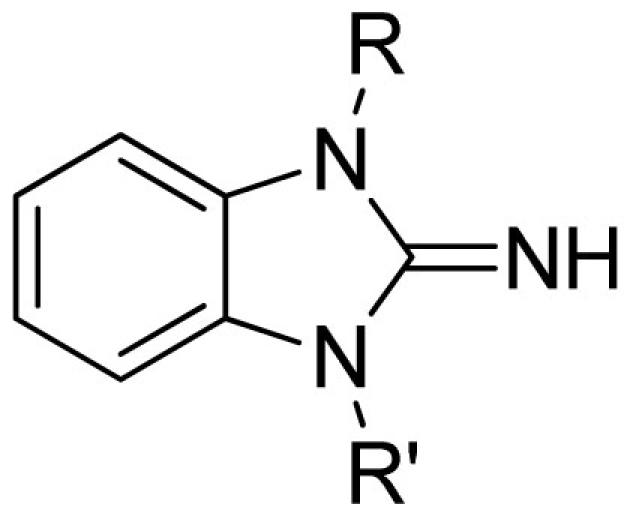 | |||||||
| Cmpd | R | R′ | VU#/Barcode |
IC50 (μM) |
|||
| Kir2.3 | Kir7.1 | GIRK | Kir1.1 | ||||
| 22 | 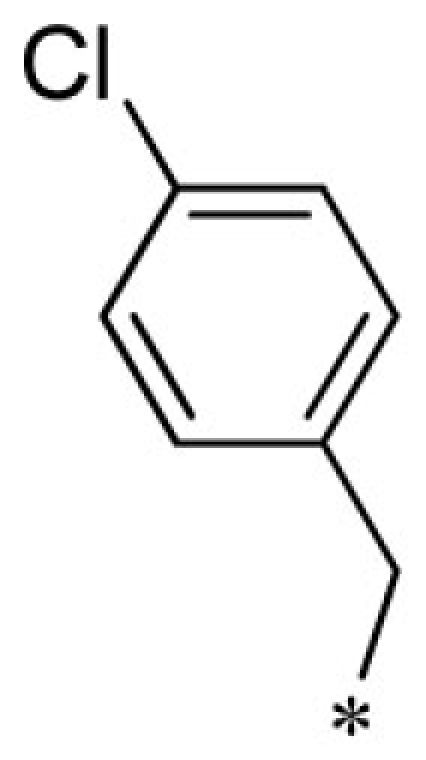 |
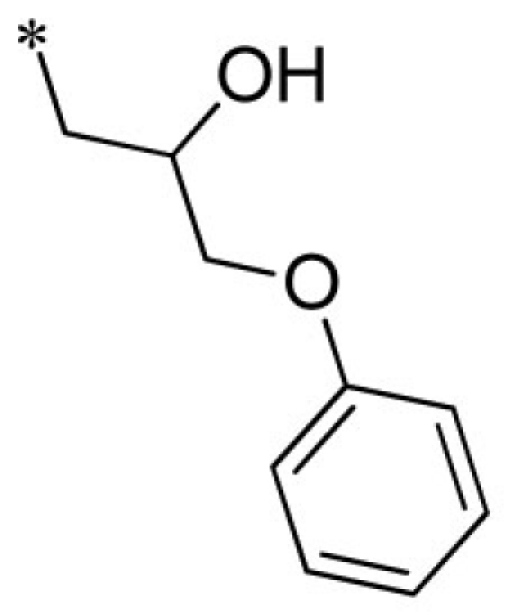 |
VU0401333-1/IC4L | 7.20 ± 1.73 | 8.93 ± 3.53 | 4.80 ± 1.10 | 14.7 ± 2.1 |
| 23 | 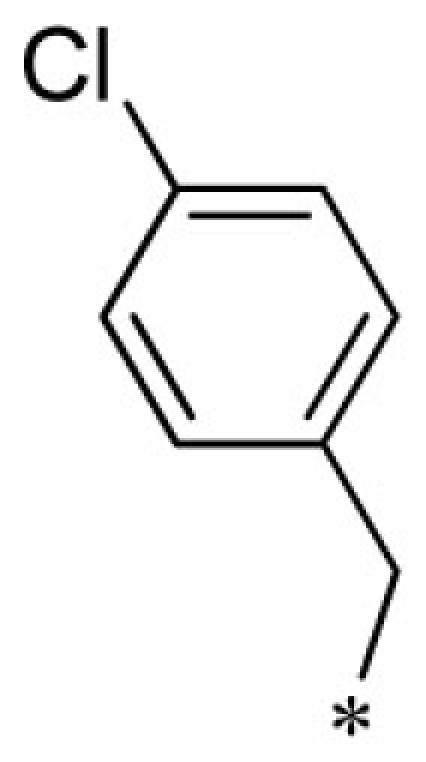 |
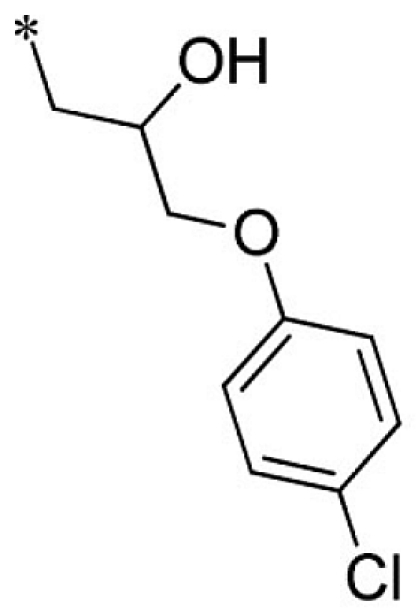 |
VU0403132-1/IC48 | 5.70 ± 3.18 | 19.5 ± 28.2 | 3.35 ± 0.92 | 6.53 ± 3.90 |
| 24 | 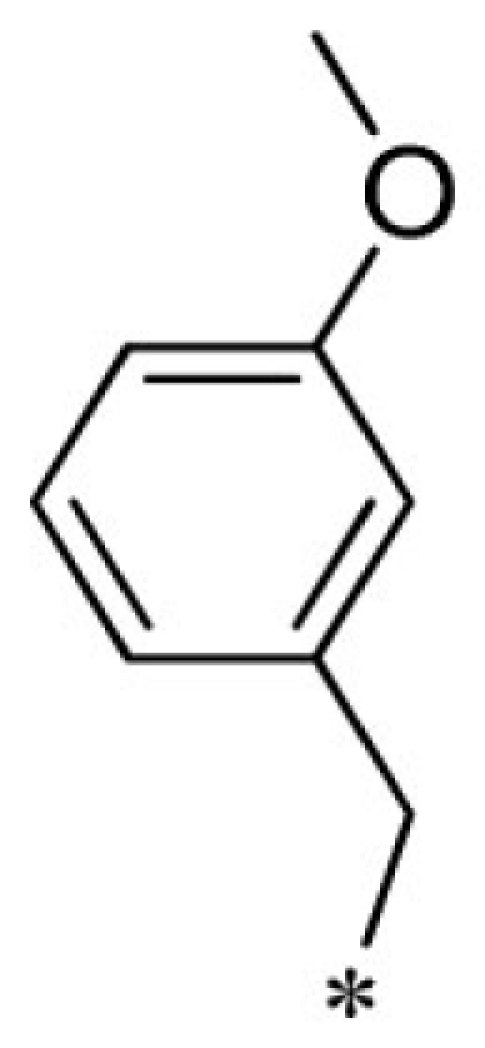 |
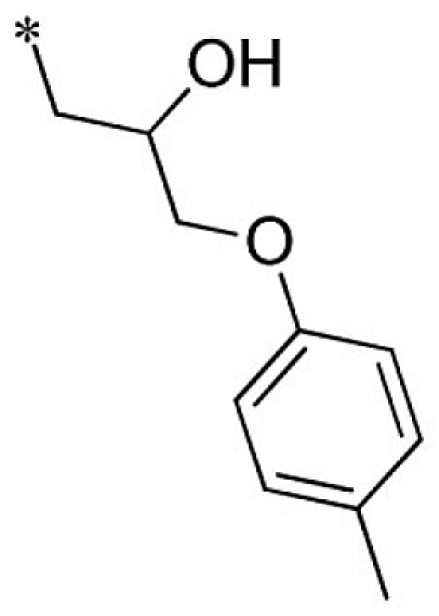 |
VU0451343-1/RJ4 | 2.80 ± 0.89 | 3.00 ± 0.87 | 4.20 ± 0.69 | 13.7 ± 4.4 |
| 25 |  |
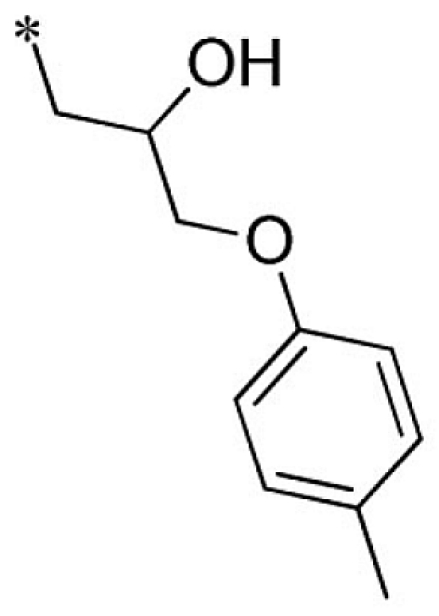 |
VU0451335-1/R5P | 16.5 ± 0.7 | 25.3 ± 8.5 | 12.3 ± 2.5 | 13.0 ± 2.6 |
| 26 |  |
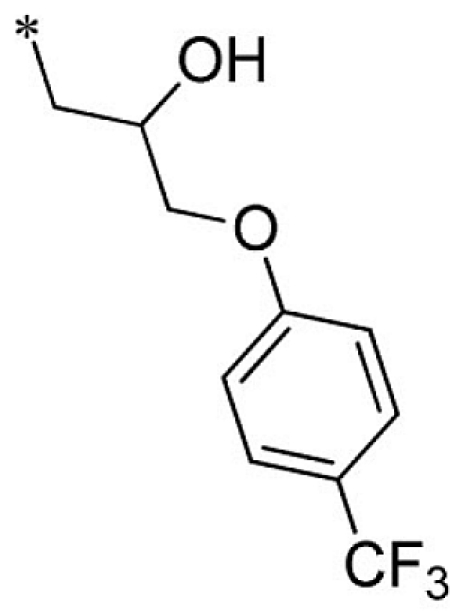 |
VU0451334-1/R7L | 4.90 ± 0.14 | 5.20 ± 1.82 | 2.87 ± 0.31 | 6.97 ± 2.00 |
Summary of structure–activity relationships of VU573 analogs. Reported IC50 values were measured by Tl+ flux assay. Values are mean ± SEM (n = 3).
