
Figure 1.
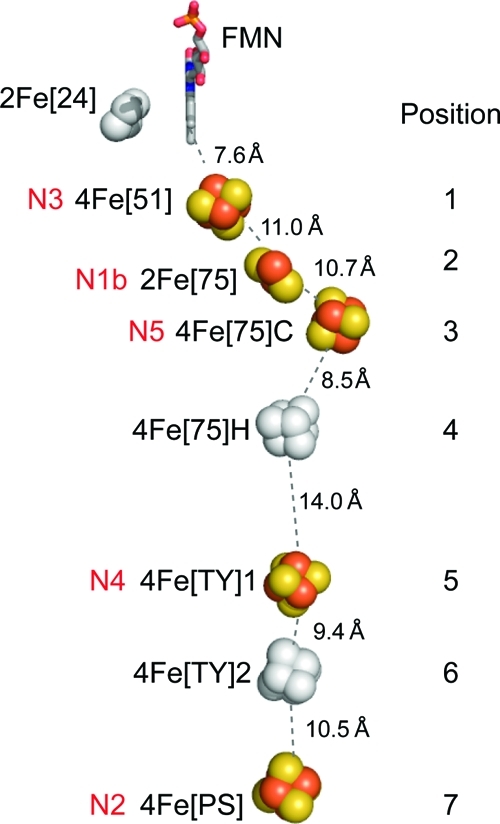
FeS clusters in mitochondrial complex I and their corresponding EPR signals. The FeS cluster arrangement is from the structure of the hydrophilic arm of complex I from T. thermophilus;5 the “N7” cluster (non-conserved) has been deleted. The clusters are named according to their cluster type and subunit location in B. taurus complex I (black), and the EPR signals (N1b, N2, N3, N4, and N5, red) that are exhibited by the NADH-reduced mitochondrial enzyme are indicated next to the clusters that they have been assigned to;9,11 clusters in gray do not contribute to the EPR spectrum of NADH-reduced mitochondrial complex I. The distances between the clusters are the distances between the centers of the two closest atoms.