Figure 1.
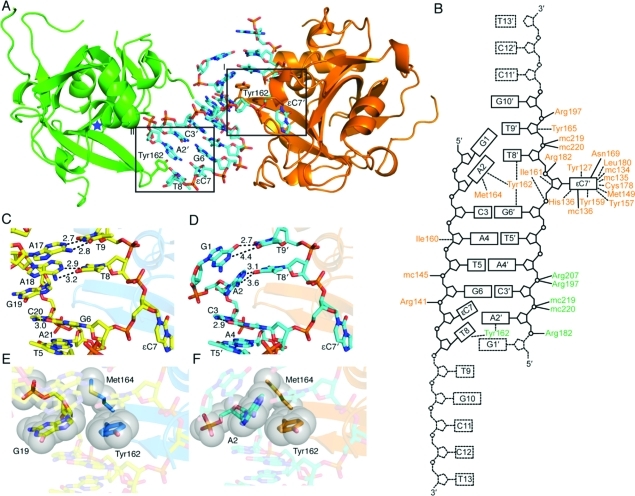
Structures of Δ79AAG bound to εC DNA. (A) Δ79AAG crystallized in the presence of ssεC DNA has two Δ79AAG molecules in the asymmetric unit: one that makes few contacts with DNA and represents a lower-affinity complex (green) and one that makes multiple contacts with DNA and represents a higher-affinity complex (orange). The two strands of ssεC DNA, which form a pseudoduplex, are shown as sticks with cyan carbons. Panel I displays Tyr162 (orange sticks) intercalating DNA while the εC lesion is flipped into the active site. Panel II depicts the lower-affinity interaction between Δ79AAG and DNA where Tyr162 (green sticks) stacks with nucleotide A2′. Atoms are colored as follows: red for oxygen, blue for nitrogen, and orange for phosphorus. A blue star denotes the location of the empty active site of lower-affinity AAG. (B) Schematic illustration of the interactions between the two strands of ssεC DNA and amino acid side chains (three-letter code) and main chains (mc) of the Δ79AAG molecules. Amino acid labels from the lower- and higher-affinity (pseudoduplex-bound) Δ79AAG molecules are colored green and orange, respectively. Hydrogen bonds are indicated by solid lines and van der Waals interactions by dashed lines. DNA bases are shown as rectangles containing one-letter codes and numbers that signify their respective positions in the oligonucleotide (5′ to 3′). All DNA bases contained in the nucleotide-flipped εC lesion strand are denoted with a prime. Disordered nucleotides are shown in dashed lines. (C) Nucleotide interactions near the lesion in Δ79AAG−εC:G dsDNA (PDB entry 3QI5) (yellow carbons). Relevant distances shown by dashed lines are given in angstroms. (D) Nucleotide interactions near the lesion in the pseudoduplex Δ79AAG structure (cyan carbons). (E) van der Waals interactions with G19 in the Δ79AAG−εC:G structure. (F) van der Waals interactions with A2 in the pseudoduplex Δ79AAG structure.

