Figure 3.
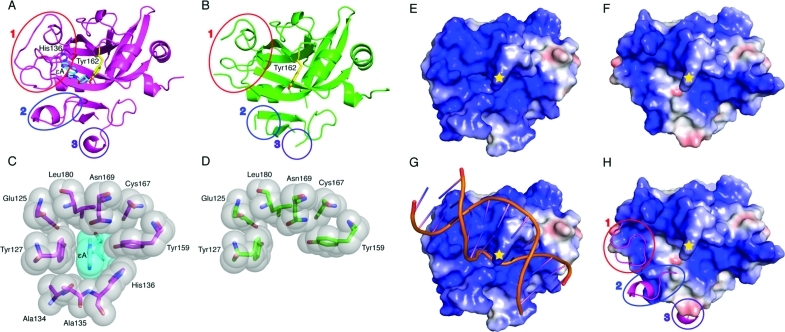
Comparison of the lower-affinity Δ79AAG structure with the high-affinity Δ79AAG−εA:T structure. (A) Δ79AAG (purple cartoon) bound to an εA lesion (stick form with cyan carbons) with active site residue His136 and intercalating Tyr162 represented in stick form with purple and yellow carbons, respectively (PDB entry 1F4R(8)). Oxygen atoms are colored red and nitrogen atoms blue. Regions that become disordered in the absence of a bound DNA adduct are circled and labeled 1–3. (B) Lower-affinity AAG (green) with Tyr162 (yellow). Loops 1–3 and other atoms are colored as in panel A. (C) Binding pocket for the εA lesion shown with van der Waals surfaces for protein residues (gray spheres) and εA lesion (cyan sphere). (D) Disrupted binding pocket in lower-affinity AAG with van der Waals surfaces colored as in panel B. (E) Electrostatic representation of Δ79AAG−εA:T calculated in the absence of DNA where blue surfaces are more positive, red surfaces more negative, and white surfaces near neutral. The position of Tyr162 is denoted with a yellow star. (F) Electrostatic representation of lower-affinity AAG with colors and symbols as in panel E. (G) Same depiction as panel E but with substrate DNA modeled (orange cartoon). (H) Same electrostatic depiction as panel F aligned and superimposed with a cartoon model (purple) of Δ79AAG−εA:T. Disordered regions that affect electrostatic potential are circled and represent the same loops as in panels A and B.

