Figure 5.
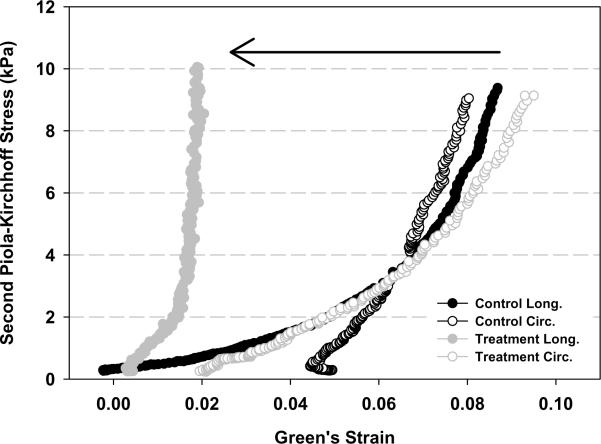
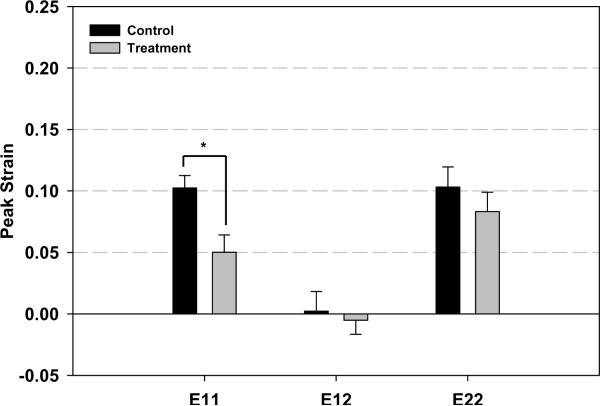
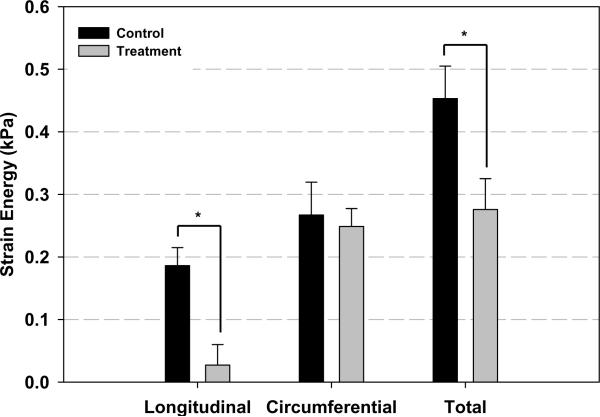
Results of the mechanical testing of the infarct tissue. Panel A presents representative stress-strain plots of specimens from both groups. Panel B and Panel C depict peak strain and peak strain energy for all groups, respectively. Longitudinal peak strain (E11) was significantly reduced in the treatment group compared to the control group. Total strain energy was also significantly less in the treatment group compared to control. As with the mean peak strain data, the directional strain energies were found to be isotropic in the treatment group and anisotropic in the control group. * p<0.05 between group difference: E11- longitudinal strain; E22-Circumferential strain; E12-longitudinal-circunferential shear strain


