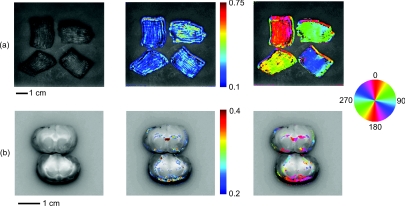
Figure 6.
Images of ex vivo samples of (a) chicken breast and (b) rat brain. From left to right: a black and white photograph, a SOI image, and a structure orientation image are shown for each sample. SOI and orientation images are superimposed over the black and white photograph after a threshold was applied.

