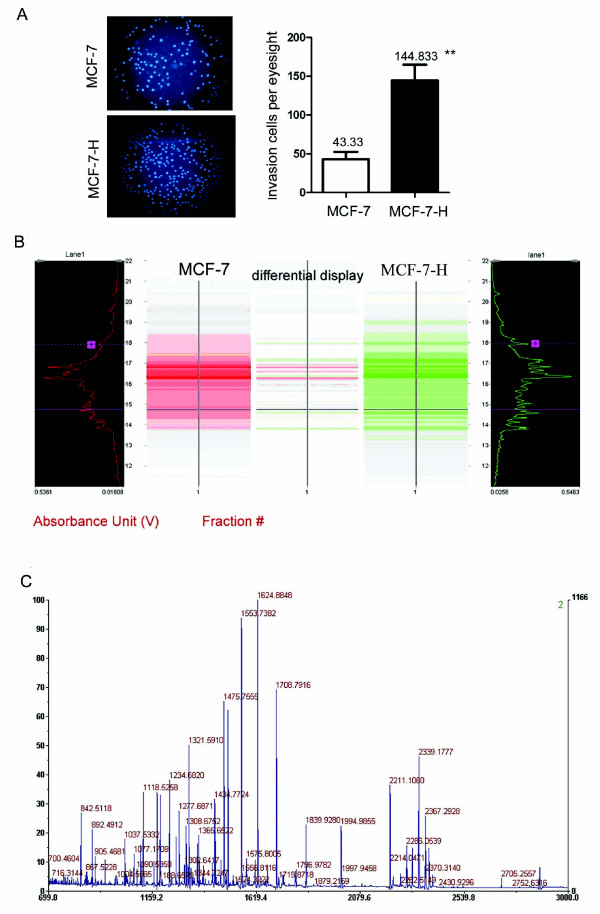
Figure 1.
Identification of ATP synthase α-subunit as a differentially expressed protein between MCF-7-H and MCF-7 cells by PF 2D and MALDI-TOF-MS. A, The sub-line MCF-7-H was selected from MCF-7 cells for high invasive ability using the trans well invasion assay, cells were stained with DAPI and the asterisks ** indicate P < 0.01. B, The display map of differentially expressed proteins between the MCF-7-H and MCF-7 cell lines. The image was analyzed by ProteoVue and DeltaVue software. ProteoVue allows comparison of multiple or all second dimension runs for one sample in a 2-D map using either gray scale or a color-coded format, where color hue or its intensity is proportional to the relative quantitative UV intensity of each peak. The DeltaVue software quantitatively displays one protein map in shades of red and the other map in shades of green. The difference between the two maps is obtained by point-by-point subtraction or by area difference and displayed as a third map in the middle. The color (red or green) at a particular location in the difference map indicates which protein is more abundant, and the color brightness indicates the quantitative difference. C, MALDI-TOF mass spectrum of ATP synthase α-subunit after trypsin digestion. MS-Digest search using the peptide mass fingerprint data indicated that 10 peptides were matched with peptides from ATP synthase α-subunit, giving sequence coverage of 28% (126/450 aa) of the protein.

