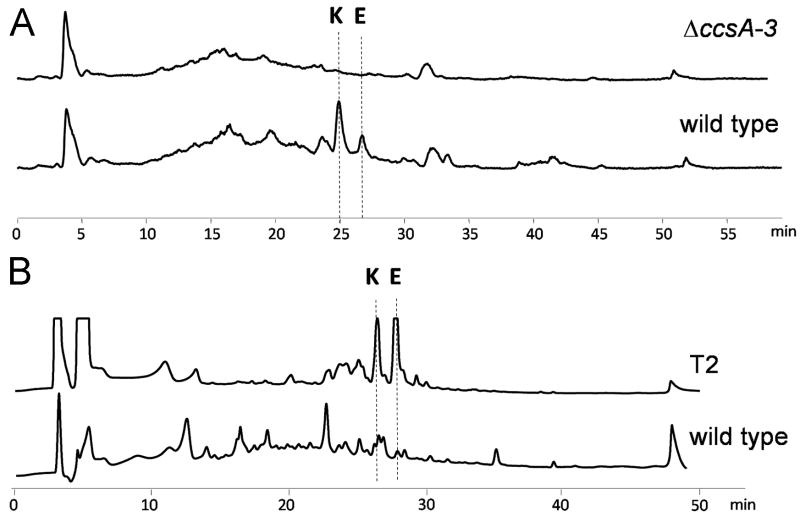
Figure 4.
Metabolic extracts of A. clavatus strains. (A) LC-MS analysis of metabolites produced by wild type and ΔccsA mutant A. clavatus strains. Total ion current chromatogram (m/z range 100-800) is shown. (B) HPLC analysis (210 nm) of metabolites produced by wild type A. clavatus and ccsR-overexpressed strain (T2). E and K stand for cytochalasin E and K, respectively.

