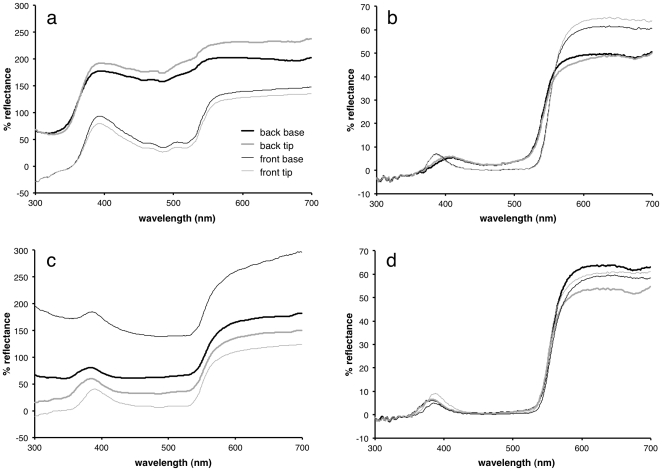
Figure 3. Reflectance curves.
a) Osteospermum pinnatum mirror angle; b) O. pinnatum pigment angle; c) Dimorphotheca sinuata mirror angle; d) D. sinuata pigment angle. Thick lines denote the back of the petals, thin lines the front; black lines denote the base of the petals, grey lines denote the tips. Panels a, b and d are the mean values for three sets of measurements; c is the mean values for five sets of measurements.

