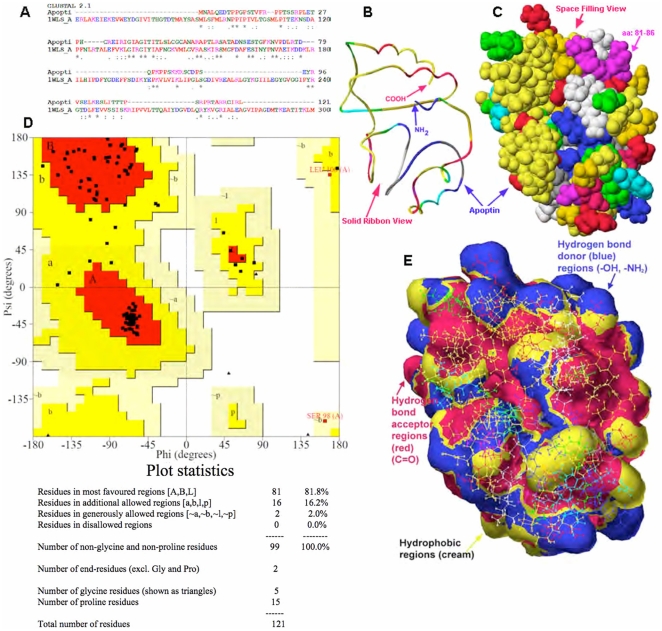
Figure 4. Sequence alignment and 3D model of Apoptin (aa: 1–121).
(A) A representative sequence alignment between apoptin residues and the residues of one of the templates from a group of templates (Table1) is shown. (B) Solid ribbon view of full-length (aa: 1–121) of 3D model for apoptin and its amino and carboxyl terminals are shown. (C) Space filling view of apoptin model, showing the potential hydrophobic proline rich interacting area (PKPPSK, aa: 81–86, pink colored region, top right) is shown. (D) Ramachandran plot showing the N-Cα and Cα-C bonds in the apoptin polypeptide chain represented by the torsion angles phi (φ) and psi (ψ); quality of the model was examined by this plot (all atoms are within the allowed regions) and by the G-factors values (the overall value for G-factors is −0.35). (E) Solvent accessible surface area shows the regions of hydrophobic (large cream colored region at the surface) where protein-protein interactions could occur and the hydrophilic regions that are involved in hydrogen bonding, hydrogen bond acceptors (red color) and hydrogen bond donors (blue color). Additional information on apoptin structure could be found in Coordinates S1, S2, S3.

