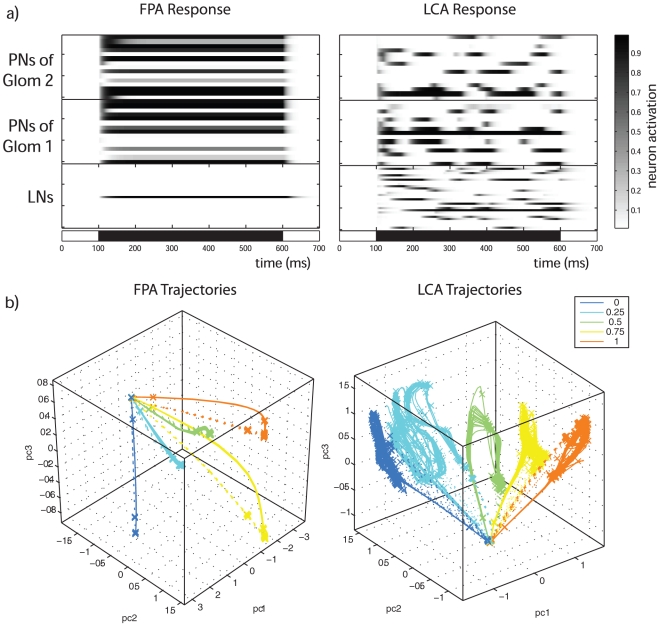
Figure 2. Examples of modelled responses.
a) These two panels show examples of the response to stimulation from a FPA network (left) and a LCA network (right). The bar in the horizontal abscissa indicates stimulus duration and timing. For illustrative purposes, a 0.5∶0.5 ratio stimulus was used. In the sub-panels, the rows are the activity for each neuron. The top two sub-panels show PN activity in the two glomeruli, while the bottom sub-panel shows LN activity. The FPA model displays transient activity patterns before settling to a stable spatial pattern around 100 ms after stimulus onset, whereas the LCA model displays rich temporal patterning during the stimulus period. b) Trajectories of the PN responses to different input ratios for the same model realizations displayed in the rasters above, each with 20 repeats perturbed with different realizations of Gaussian white noise of  = 0 and
  = 5
= 5 10–4. The first three principal components have been taken to produce 3-dimensional plots so that a point in these plots represents a spatial response pattern at an instant in time (bin size was 5 ms). Solid lines indicate the trajectories during stimulation, while dotted lines indicate return trajectories after stimulation. The crosses are plotted at regular time intervals of 50 ms, and thus indicate the local velocity of the trajectories and its variability between trials. The different network behaviours are also apparent in these plots. The time in which the mean Euclidean distance between the trajectories reaches a maximum value is 358
 198 ms for FPA, and 226
 143 ms for LCA (
 for 20 model realizations, p = 0.02 in the t-test).

