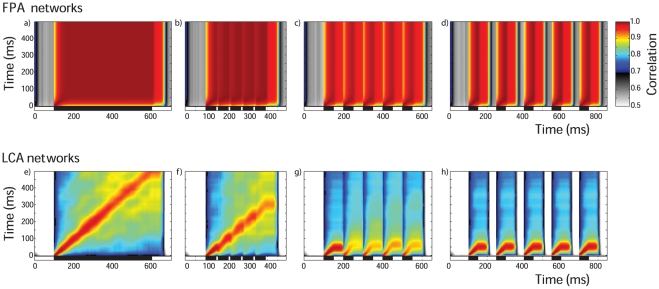
Figure 4. Cross correlation and stimulus timing.
Cross correlation and stimulus timing. Time-binning the PN population responses results in a series of instantaneous spatial activity patterns. The spatial activity patterns for a 500 ms duration stimulus (vertical axis) were correlated with the spatial patterns from differently timed pulsed stimuli (indicated by bars on horizontal abscissas). This was done for FPA networks (a–d) as well as for LCA networks (e–h). The pulse patterns are: a) one 500 ms pulse and; b) five 50 ms pulses with inter-stimulus intervals of 10 ms, c) 50 ms and d) 100 ms. The same patterns were used for LCA (e–h). The correlation coefficients shown are mean values taken from 400 random input ratios and 20 networks. The different network behaviours between FPA and LCA networks result in very different looking cross correlation maps for the 500 ms pulse results (a and e). FPA networks show high correlation throughout periods of stimulation, indicating that the spatial patterns are very similar across time-bins (a). LCA networks display lower correlations, with highest values in a thin region along the diagonal (e). For both FPA and LCA networks, very short inter-stimulus intervals of 10 ms have little effect except to slow the progression of the sequence of spatial patterns (b and f). The pulses with long inter-stimulus intervals of 100 ms do not interfere, and each pulse elicits a separated response that is almost identical to each other pulse (d and h). However, for 50 ms inter-stimulus intervals, the tail of the previous pulse overlaps with the next response (c and g). This has no apparent effect on FPA models, but LCA models show a marked difference in the shape of pattern of correlation for pulses following the first.

