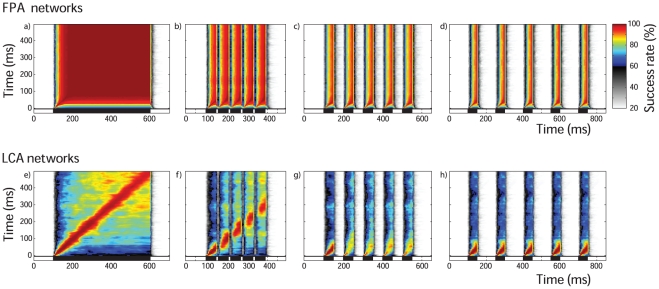
Figure 5. Cross classification and stimulus timing.
Again, we use the series of instantaneous spatial patterns as in Figure 4. FPA (a–d) and LCA (e–h) networks were repeatedly stimulated with 500 ms pulses of five different ratios. The subsequent PN spatial patterns for each time-bin were used to train a linear model. The networks were also stimulated with the differently timed pulses of the same 5 ratios, generating spatial patterns which were then classified by the linear model, estimating which ratios generated each spatial pattern (see methods). The colour scale is the same for all panels, and shows the mean success rate for multiple trials and networks. 20% is the chance success rate. For the single pulse of 500 ms, there is high accuracy along the diagonal for both FPA and LCA networks (a and e). LCA networks have a thin region around the diagonal of high accuracy (e), indicating a smooth transition between spatial patterns, which are constantly switching. FPA networks simply show a block of high accuracy (a), indicating that the spatial patterns change very slowly or not at all. The dynamics is not affected for inter pulse intervals of 10 ms (b and f) and 100 ms (d and h). For inter pulse intervals of 50 ms, LCA models suffer a big drop in classification accuracy as the tail of responses to the first pulse is confounded with the spatiotemporal responses of subsequent pulses (g), while FPA responses allow classification in each pulse just as if they were presented individually (c).

