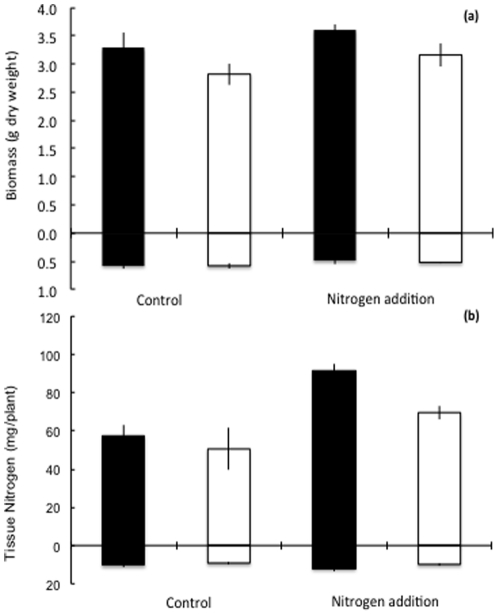
Figure 1. Mean shoot (above X-axis) and root (below X-axis).
(a) dry weights, and (b) plant nitrogen contents, of the 76R (black bars) and rmc (white bars) genotypes of tomato, following the application of nutrient addition treatments (nitrogen or control). Values are mean ± S.E. The shoot dry weight of 76R plants was significantly greater than of rmc plants, irrespective of nutrient addition treatments; the nitrogen content differed significantly between genotypes irrespective of nutrient addition treatments, and vice versa; see text for details.

