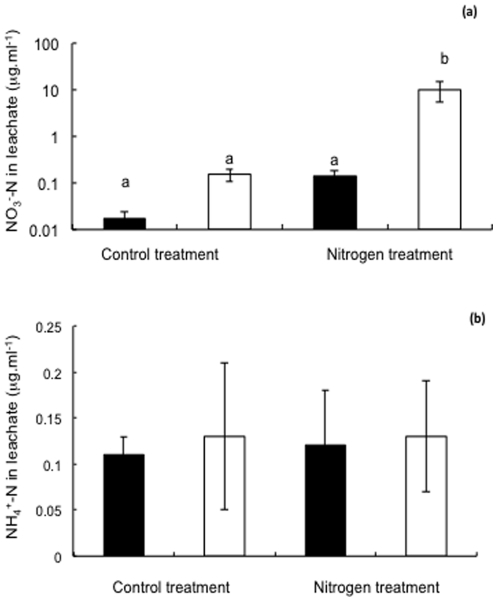
Figure 2. Concentration of (a) NO3 −-N and (b) NH4 +-N in leachate, collected from columns containing 76R (black bars) and rmc (white bars) genotypes of tomato, following the application of nutrient addition treatments (nitrogen or control).
Values are mean ± S.E. Means followed by the same letter are not significantly different at the P<0.05 level. See text for results of targeted statistical analyses comparing genotypes within specific nutrient addition treatments.

