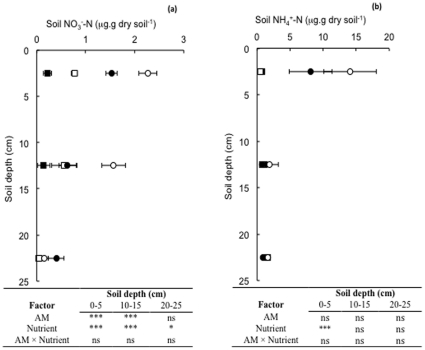
Figure 3. Soil (a) NO3 −-N and (b) NH4 +-N, concentrations with depth (data plotted at mid-point of sampling depth) in columns containing mycorrhizal (closed symbols) and non mycorrhizal (open symbols) tomato plants in the nitrogen addition (circular symbols) and water control nutrient addition (square symbols) treatments.
Values are means ± standard error. ANOVA Tables are given below Figures, see text for additional details of statistical analysis. *, **, *** = significant at P<0.05, 0.01, 0.001 levels respectively. ns = not significant, P>0.05.

