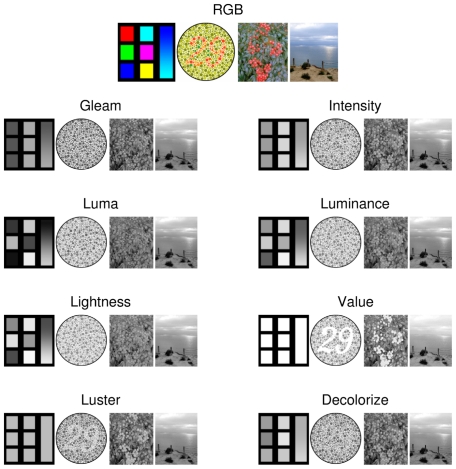
Figure 1. Qualitative comparison of color-to-grayscale algorithms.
The four images shown are: (1) a panel of fully saturated colors; (2) Ishihara plate 3, in which a person with normal vision will see the number 29, while a person with red-green deficient vision may see the number 70; (3) a green shrub laden with red berries; and (4) a picture of the Pacific Ocean. All images are shown gamma corrected so that the details are not excessively dark, except for Gleam, Luma, and Lightness. The color panel contains fully saturated colors, which Value, Intensity, and Luster convert to the same shade of gray; however, humans do not perceive these colors as having equivalent brightness which is a trait captured by Lightness and Luminance. Gleam, Intensity, Luminance, Lightness, and Decolorize all lose most of the chromatic contrast present in the Ishihara plate, while Luster, and Value preserve it. The same pattern of chromatic contrast degradation is present in the fruit image, with the fruit becoming much more difficult to distinguish from the leaves for some of the methods.

