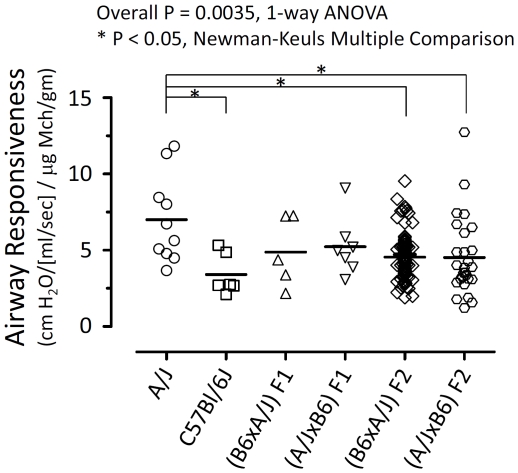
Figure 1. Airway responsiveness of mice from parental strains, F1 generations, or F2 generations as shown.
Each individual symbol represents the datum of a single mouse; horizontal lines show mean values. Airway responsiveness is calculated as Newtonian resistance at the highest dose of methacholine, divided by that dose of methacholine normalized to body weight. B6 - C57BL/6J.

