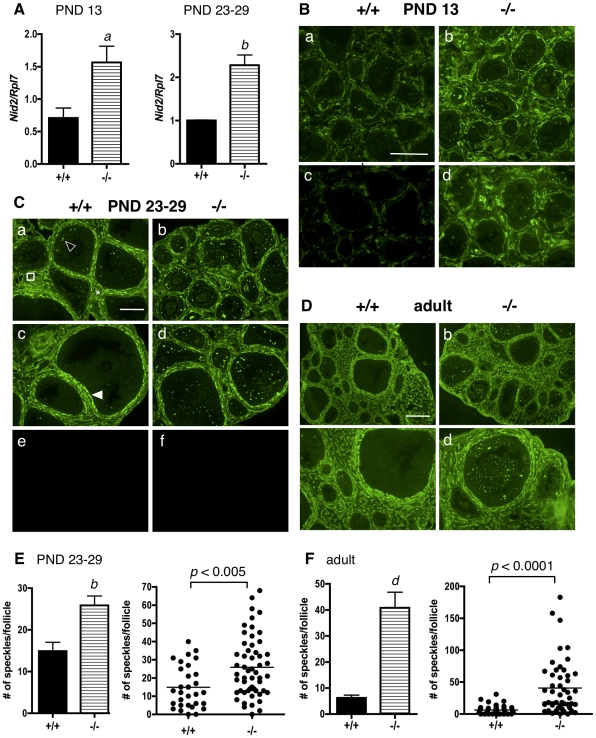
Figure 2. Nidogen 2 mRNA and protein levels are higher in granulosa cells and ovaries of ERβ-null mice than in wildtype mice.
A. Granulosa cells were isolated and pooled from ovaries of untreated PND13 or PND 23–29 wildtype (+/+) or ERβ-null (−/−) mice, and the levels of Nid2 mRNA were determined by quantitative RT-PCR compared to an Rpl7 control (± SEM of three independent experiments). Wildtype and ERβ-null average mRNA levels were compared using an unpaired two-tailed Student's t-test. a: p<0.05; b: p<0.01. B–D. Immunofluorescence with an anti-NID2 antibody was used to detect NID2 localization and expression in ovaries isolated from wildtype (+/+) and ERβ-null mice (−/−) at (B) PND 13 (a–d), (C) PND 23–29 (a–d; negative controls with secondary antibody only are shown in e and f), and (D) PND 60 (adult). Various magnifications are shown at each age. (B) Scale bar = 100 µM for a–b, and 50 µM for c–d. (C) Two different sections from each genotype are shown (same magnification for both sections). Scale bar = 100 µM for a–f; (D) Scale bar = 200 µM for a–b, 100 µM for c–d. NID2 is localized to the follicular basal lamina (white filled arrowhead), focimatrix (open arrowhead), thecal matrix (asterix), and endothelial basal lamina of stromal blood vessels (square). (E, F) Focimatrix speckles in the PND 23–29 and adult sections were counted per follicle, and the difference between genotypes analyzed by a two-tailed, un-paired Student's t-test (± SEM, left panel) and by Receiver Operating Characteristic analysis (right panel). Each dot in the scatter plot (right panel) represents one follicle. b: p<0.01; d: p<0.0001.

