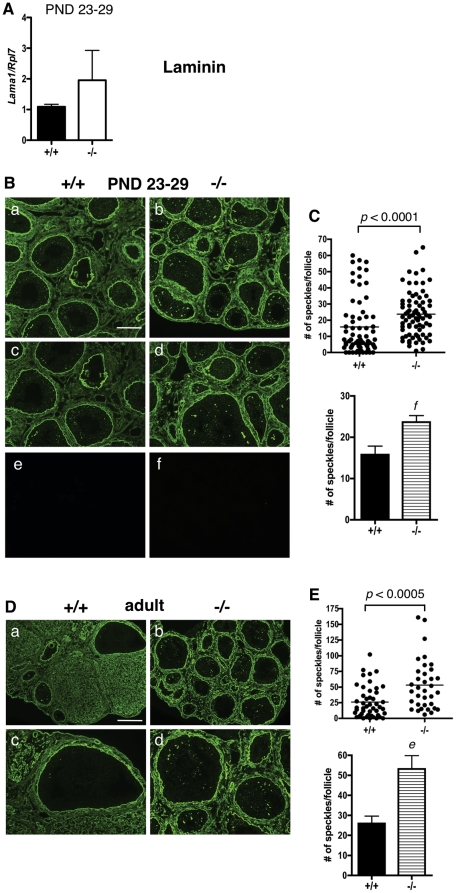
Figure 5. Laminin expression and localization in immature and adult ERβ-null and wildtype mouse ovaries.
A. Granulosa cells were isolated and pooled from ovaries of untreated PND 23–29 wildtype (+/+) or ERβ-null (−/−) mice, and the levels of Lama1 mRNA were determined by quantitative RT-PCR compared to an Rpl7 control (± SEM of three independent experiments). B. Immunofluorescence with an anti-laminin antibody was used to detect laminin localization and expression in ovaries isolated from wildtype (+/+) and ERβ-null (−/−) mice at PND 23–29 (a–d; negative controls with secondary antibody only are shown in e and f) wildtype (+/+) and ERβ-null (−/−) mice. Two magnifications are shown. Scale bar = 200 µM for a–b, 100 µM for c–d. C. Focimatrix levels of laminin were quantified by counting the number of focimatrix speckles/follicle, and these values compared between genotypes by Receiver Operating Characteristic analysis (top panel) and a two-tailed, un-paired Student's t-test (± SEM, bottom panel). Each dot in the scatter plot (top panel) represents one follicle. f: p<0.005. D. Laminin expression in adult ERβ-null and wildtype mouse ovaries. Immunofluorescence with anti-laminin antibodies was used to detect laminin localization and expression in ovaries isolated from adult wildtype (+/+) and ERβ-null (−/−) mice. Two magnifications are shown. Scale bar = 200 µM for a–b, 100 µM for c–d. E. Expression of laminin in the focimatrix was quantified by counting the number of focimatrix speckles/follicle, and these values were compared between genotypes by Receiver Operating Characteristic analysis (top panel) and a two-tailed, un-paired Student's t-test (± SEM, bottom panel). Each dot in the scatter plot (bottom panel) represents one follicle. e: p<0.0005.

