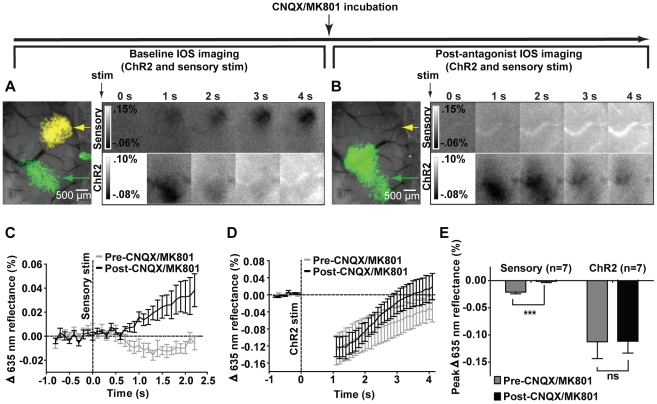
Figure 3. Blockade of synaptic transmission by CNQX and MK801 inhibits forepaw stimulation responses but not ChR2.
A, left: Pre-antagonist IOS responses to sensory stimulation (yellow, indicated by yellow arrow) and ChR2 stimulation (green, indicated by green arrow) thresholded to 50% of maximum and superimposed on an image of the cortical surface. Right: Temporal evolution of IOS responses to 1 s of sensory stimulation (upper) and ChR2 stimulation (lower). B, left: Post-antagonist IOS response to sensory stimulation is inhibited (yellow arrow indicates pre-antagonist map location), while the IOS response to ChR2 stimulation is preserved (green, indicated by green arrow). Right: Temporal evolution of IOS responses to 1 s of sensory stimulation (upper) and ChR2 stimulation (lower). A,B Shown are the averaged results of 20 trials from a representative animal; blanked data at 0 s represents stimulus artifact. C, Temporal profiles of IOS responses to 1 s of sensory stimulation before and after CNQX/ MK801 incubation (n = 7); responses are displayed until pre-CNQX/MK801 responses return to baseline. D, Temporal profiles of IOS responses to 1 s of ChR2 stimulation before and after CNQX/MK801 incubation (n = 7); blanked data indicate laser stimulus artifact. C,D Stimulus onset denoted by vertical dotted line. E, Peak amplitudes in sensory-evoked IOS responses were significantly reduced following antagonist incubation (paired t-test, p = 0.0009) while peak ChR2-evoked IOS responses were not (paired t-test, p = 0.9358). Error bars represent SEM.

