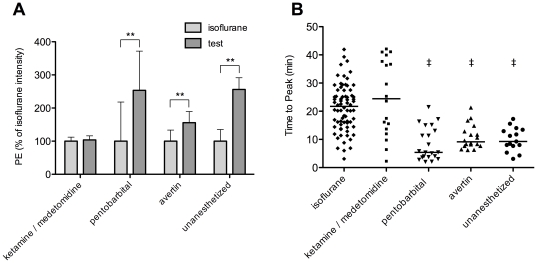
Figure 6. In vivo comparison of anesthetics.
(A) represents the maximum BLI intensity obtained from the same mice anesthetized with isoflurane or the test anesthetic mentioned below the curve. Values were normalized to isoflurane signal intensities. (B) shows a scatter plot of the time to the peak signal intensity for the different anesthetics. Each data point represents a unique bioluminescent acquisition from the in vivo comparison of anesthetics study. Lines indicate the mean. There was a significantly later peak for ketamine/medetomidine and isoflurane as compared to avertin, pentobarbital and unanesthetized animals. ** p<0.01 between indicated conditions; ‡ p<0.05 compared to both isoflurane and ketamine/medetomidine.

