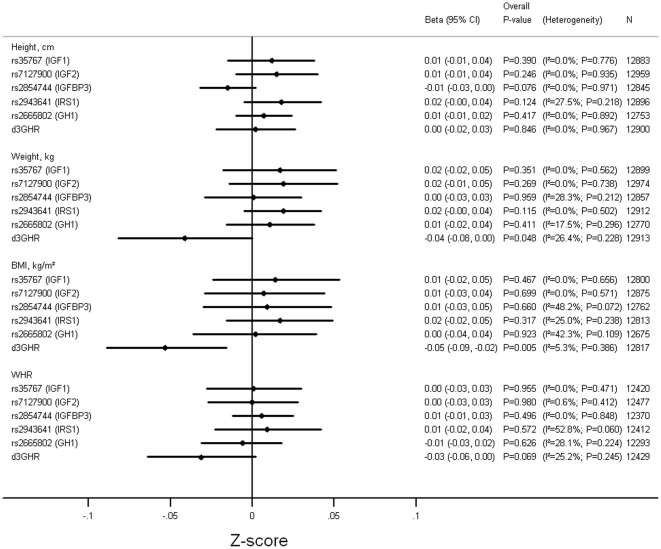
Figure 1. Pooled Results of Associations between Genotypes and Measures of Anthropometry.
Adjusted for age and sex. Models used: rs35767 (IGF1)- (C/T+T/T) vs. C/C; rs7127900 (IGF2)- (C/T+T/T) vs. C/C; rs2854744 (IGFBP3- per minor (A) allele; rs2943641 (IRS1)- per minor (T) allele; rs2665802 (GH1)- per minor (T) allele; d3GHR- (fl/d3+d3/d3) vs. fl/fl. fl: full length; d3: exon-3 deletion.

