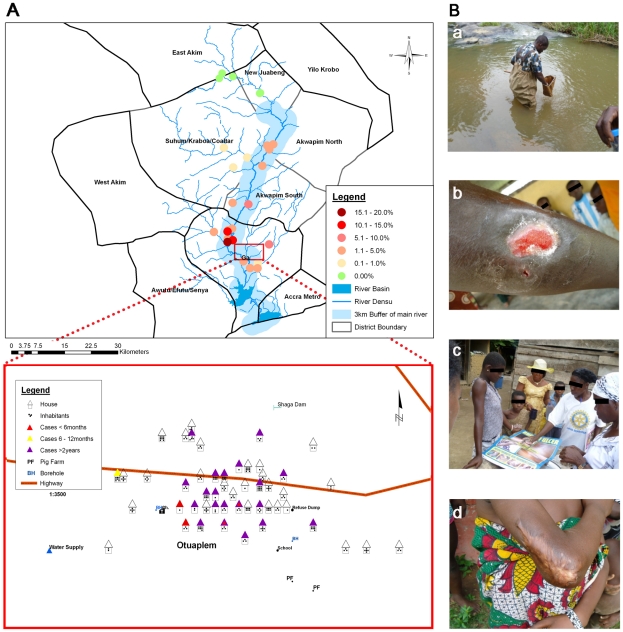
Figure 2. Prevalence of BU and sample collection procedure.
A Map showing the prevalence of BU in selected communities along the Densu River. The prevalence rate was calculated by adding the number of individuals both with active or healed BU lesions divided by the total population number of the community. Exemplarily, the housing and population census is illustrated for the village Otuaplem. B Photographs illustrating environmental sampling (a), reconnaissance visit in the communities (b), an active BU lesion found in a community during active search (c) as well as a healed BU lesion also identified in a community (d).

