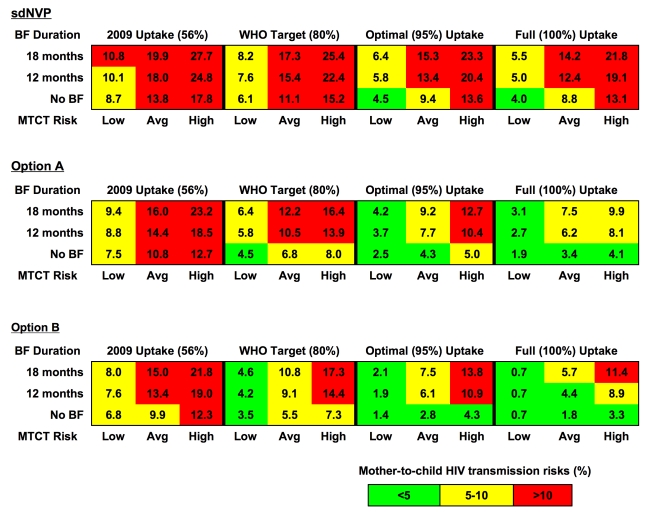
Figure 3. Combinations of parameters needed to achieve MTCT risks<5%, 5%–10%, and >10%.
Each horizontal block represents results for a specific drug regimen: sdNVP (top), Option A (middle), and Option B (bottom). Within each block, four levels of uptake are depicted across the top horizontal axis: 56% uptake (current estimated uptake in Zimbabwe), 80% uptake (the WHO target), 95% uptake (reported in neighboring Botswana), and 100% uptake (to reflect maximum biologic efficacy of each regimen). The vertical axis illustrates three durations of breastfeeding (BF) for each modeled PMTCT regimen: 18 mo (median in Zimbabwe), 12 mo (concordant with 2010 WHO infant feeding guidelines), and no breastfeeding; ARV prophylaxis in the Option A and Option B regimens is assumed to continue throughout the duration of breastfeeding. The lower horizontal axis shows three categories of published MTCT risks for each drug regimen, including the lowest published risks, the average of published risks (the base-case parameters), and the highest published risks. The percentage in each cell reflects the MTCT risk associated with each set of parameters, and cells are color-coded to reflect broad categories of transmission. Red-colored cells indicate MTCT risks>10%, yellow-colored cells indicate MTCT risks between 5% and 10%, and green-colored cells indicate MTCT risks<5%.

