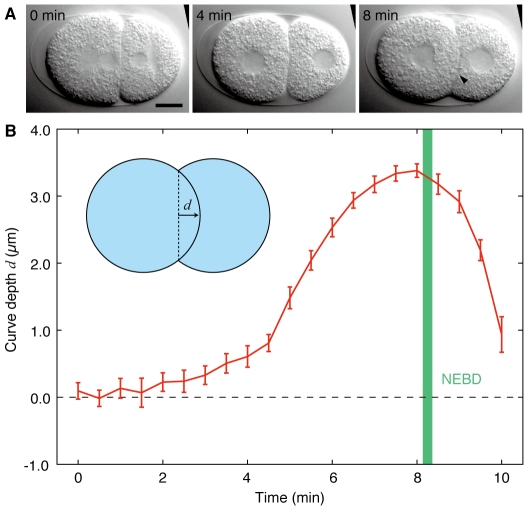
Figure 1. Contact surface curves into the posterior blastomere.
(A) Images from time-lapse DIC microscopy of a wild-type N2 embryo. The anterior end is oriented to the left. The larger anterior cell is AB, and the smaller posterior cell is P1. Arrowhead indicates a curved contact surface. (B) Depth of the curved contact surface d as a function of time during the two-cell stage. Inset shows the definition of d. Green, mean±s.e.m. interval of NEBD of AB. Error bars indicate s.e.m. n = 20. Time is from the onset of the two-cell stage. Scale bars, 10 µm.

