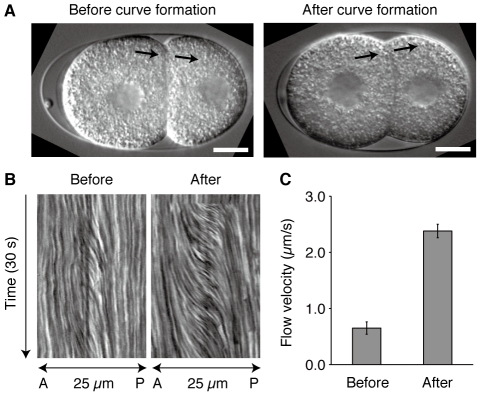
Figure 2. Laser-induced cell fusion is accompanied by cytoplasmic flow.
(A) AB and P1 were laser fused either before (left) or after (right) their contact surfaces formed curves. Arrows indicate the location and direction of the observed flow of cytoplasmic granules. Scale bars, 10 µm. (B) Kymographs of cytoplasmic flow. A, anterior; P, posterior. (C) The velocity of cytoplasmic flow before and after curve formation (n = 10 each). Error bars indicate s.e.m.

