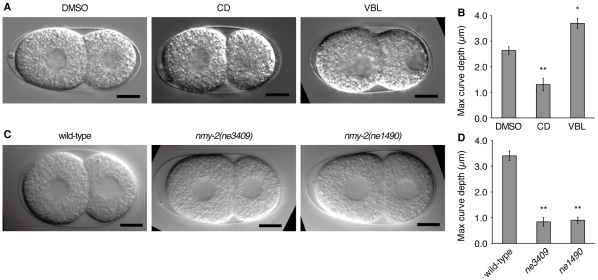
Figure 3. Curvature of the contact surface is dependent on actomyosin.
(A) DIC images of embryos treated with cytoskeletal inhibitors. CD, cytochalasin D; VBL, vinblastine. Images were taken 8 min after the onset of the two-cell stage. (B) Maximum curve depth of the drug-treated embryos (n = 10 each). (C) DIC images of ts mutants of nmy-2 at the restrictive temperature. Images were taken immediately before NEBD of AB. (D) Maximum curve depth in the nmy-2 embryos at the restrictive temperature (n = 10 each). Error bars indicate s.e.m. *, P<0.01; **, P<0.001; Mann–Whitney test. Scale bars, 10 µm.

