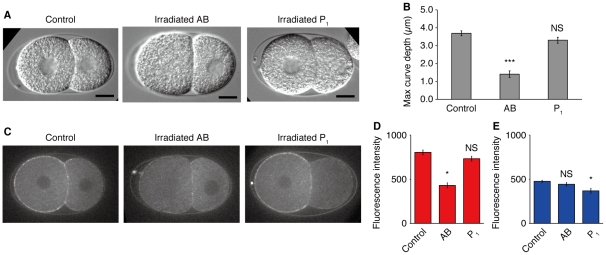
Figure 5. UV irradiation to the AB nucleus impairs curve formation.
(A) DIC images of the embryos in which their nuclei were irradiated by a UV laser. The images were taken 8 min after the onset of the two-cell stage. Scale bars, 10 µm. (B) Maximum curve depth of the contact surfaces. AB, UV irradiation to the AB nucleus (n = 10); P1, UV irradiation to the P1 nucleus (n = 10). (C) Embryos that expressed NMY-2::GFP and their nuclei were irradiated by UV. 8 min after the onset of the two-cell stage. (D and E) Fluorescence intensity at the cell cortex. Control, untreated embryos (n = 6); AB, UV irradiation to the AB nucleus (n = 7); P1, UV irradiation to the P1 nucleus (n = 5). (D) Cortex of AB cell. (E), Cortex of P1 cell. Error bars indicate s.e.m. *, P<0.01; ***, P<0.0001; NS, non-significant (P>0.1); Mann–Whitney test.

