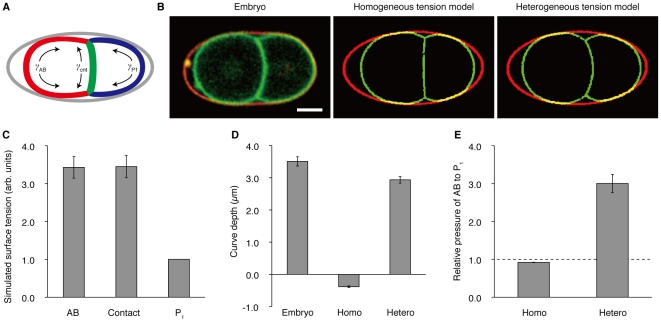
Figure 6. Computer simulation of the homogeneous and heterogeneous tension models.
(A) Graphical representation of the simulation model. Gray, the eggshell; red, the outer surface of AB; blue, the outer surface of P1; green, the contact surface. γ AB, γ P1, and γ cnt denote the surface tension parameters. (B) Left, a confocal image of an embryo that has the GFP-tagged plasma membranes and the TRITC-stained eggshell. Center, a simulated cell shape using the homogeneous tension model. Right, a simulated cell shape using the heterogeneous tension model. (C) Surface tension parameters that made the heterogeneous tension model most similar to the GFP::PH embryos. The results of 20 simulations that correspond to the 20 observed embryos are shown. AB, surface tension parameter γ AB. Contact, surface tension parameter γ cnt. P1, surface tension parameter γ P1. (D) Curve depth of the contact surfaces. Embryo, GFP::PH embryos; Homo, the homogeneous tension model; Hetero, the heterogeneous tension model. (E) Ratios of the simulated pressures between AB and P1. The values indicated are the ratio P AB/P P1, where P AB is the pressure inside AB, P P1 is the pressure inside P1. Error bars indicate s.e.m. Scale bars, 10 µm.

