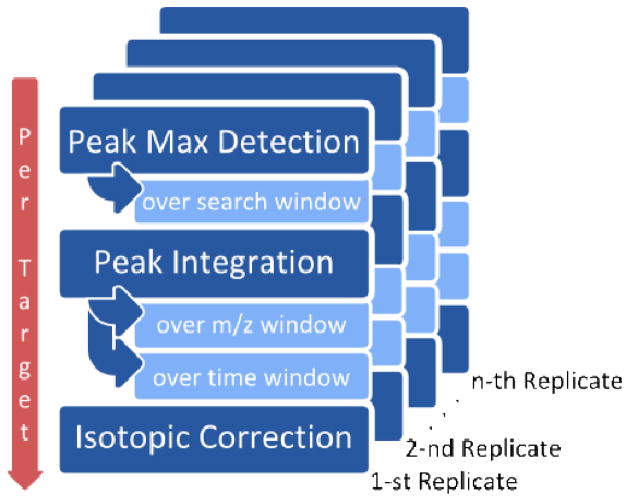
Figure 1. Computational algorithm.
For every target composition, the program finds the local feature maximum (monoisotopic peak) and integrates the area-under-the-curve around this maximum; the user is able to provide a time window for searching, and both window time and mass-to-charge ratio window for integrating. The overall abundance measured for the target is then calculated from this measurement using its isotopic distribution. This process is repeated over any number of replicates.

