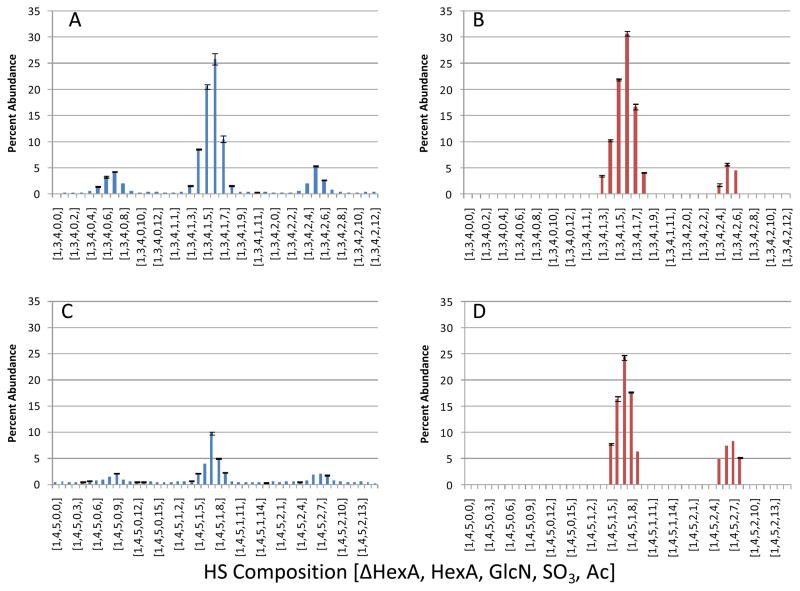
Figure 4. Differences in percent abundance from integration technique.
A, Percent abundance of unsaturated dp8 oligosaccharides calculated using the Manatee approach. B, Percent abundance of select unsaturated dp8 oligosaccharides calculated manually. C, Percent abundance of unsaturated dp10 oligosaccharides calculated using the Manatee approach. D, Percent abundance of select unsaturated dp10 oligosaccharides calculated manually. A major difference in the two approaches is seen with the integration of noise in A and C. HS compositions are give as [ΔHexA, HexA, acetate, SO3].

