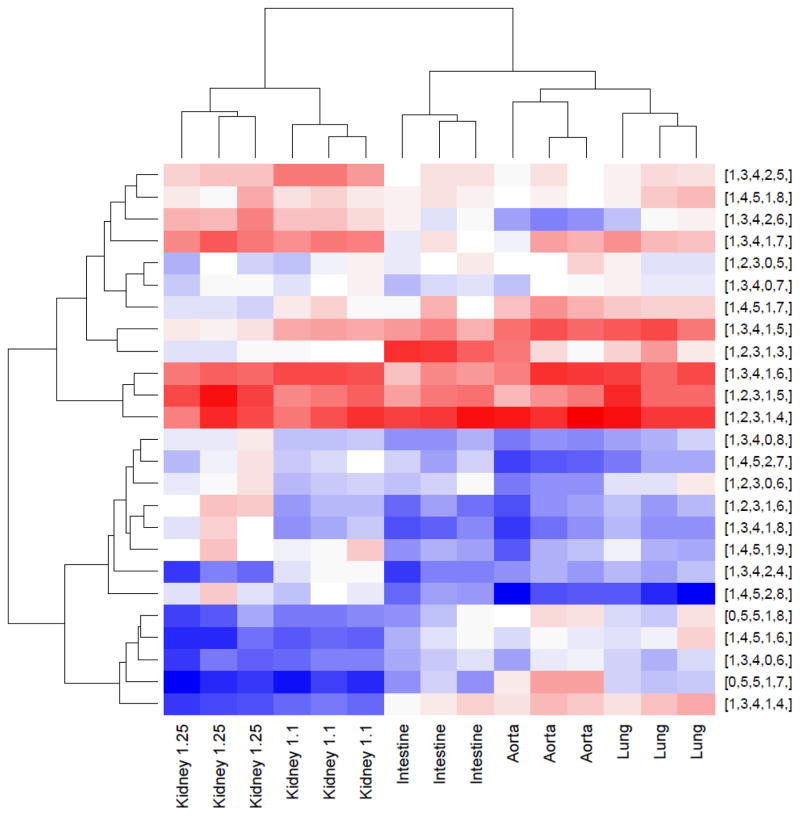
Figure 6. Unsupervised heat map of the 25 most abundant HS compositions in the five organ tissue dataset with hierarchical clustering of rows and columns.
Red indicates higher abundance, while blue represents lower abundance. Note that all replicates cluster together and that the kidney samples cluster together, as well. HS compositions are give as [ΔHexA, HexA, acetate, SO3].

