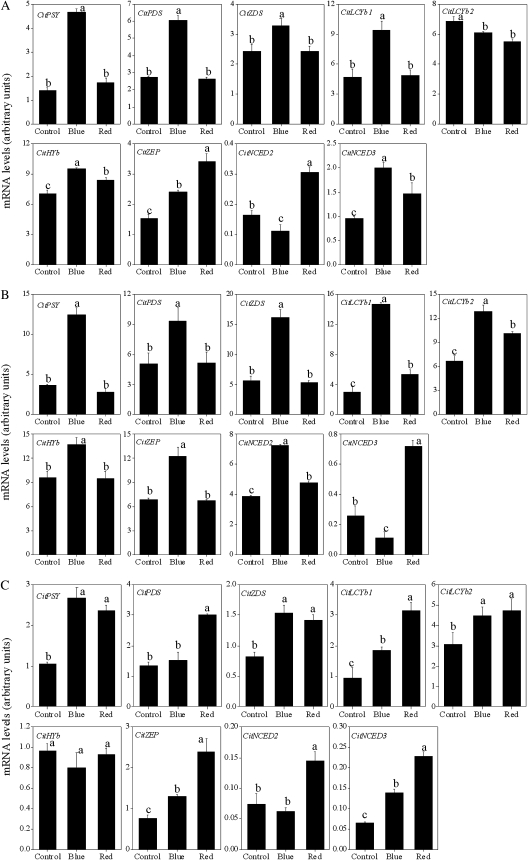
Fig. 6.
Effect of blue and red LED lights on the expression of carotenoid metabolism-related genes in juice sacs of the three citrus varieties. (A) Satsuma mandarin; (B) Valencia orange; (C) Lisbon lemon. Columns and bars represent the means and SE (n=3), respectively. The letters a, b, and c indicate significant differences among the control, blue light, and red light treatments at the 5% level by Tukey’s HSD test.

